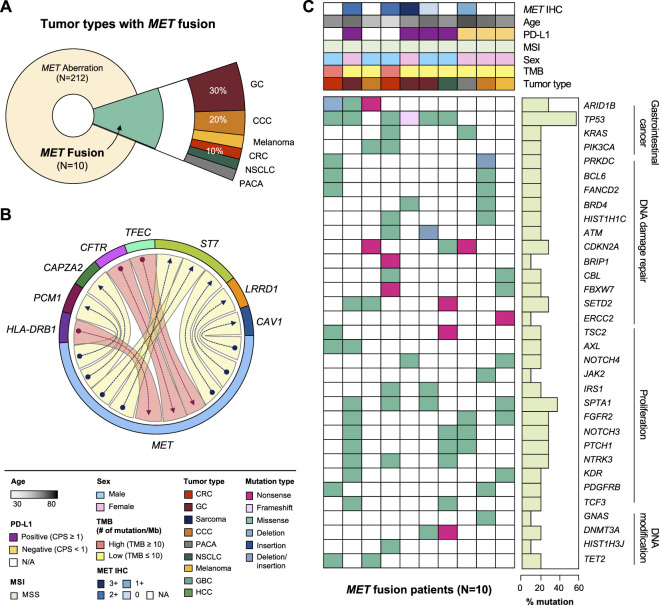
FIGURE 3.
Clinicopathological landscape of patients with MET fusions. (A) Diagram showing the distribution of patients and tumor types with MET fusion. (B) Chord diagram exhibiting flows or connections between the MET gene and other partner genes. (C) Landscape of the patient’s genomic profile. Upper panel, clinical information regarding MET expression (IHC), age, PD-L1, MSI, sex, TMB, and tumor type; lower panel, SNV profile of genes indicated at the left panel; right panel, mutation rate of each gene and biological functional annotation. IHC, immunohistochemistry; MSI, microsatellite instability; TMB, tumor mutational burden; SNV, single nucleotide variant.

