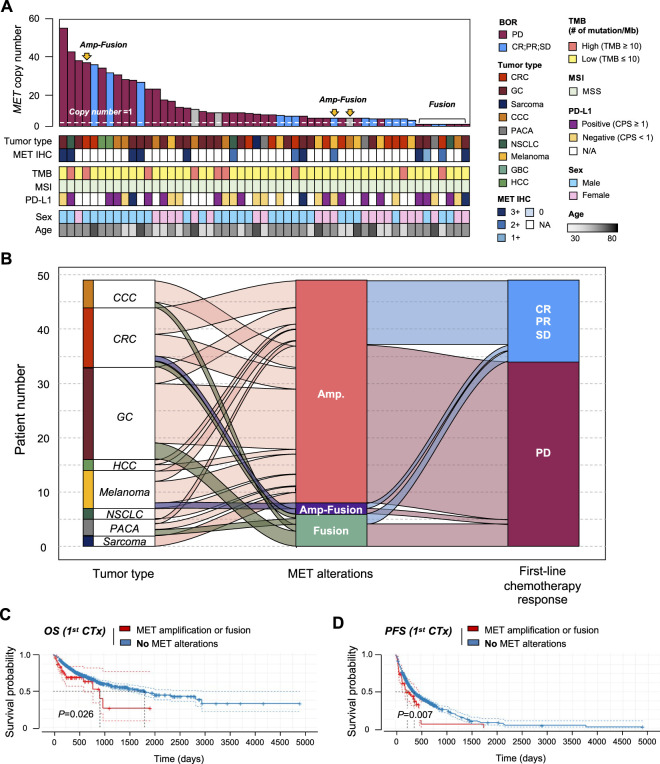
FIGURE 5.
Correlation between MET gene alterations and response to first-line chemotherapy. (A) Cancer genomic landscape refers to the distribution pattern of MET gene alterations across the genome in tumor types. (B) Alluvial diagram showing the distribution of MET aberration in tumor types and the best response to first-line chemotherapy. Kaplan-Meier curves showing (C) overall survival (OS) and (D) progression-free survival (PFS) with (amplification of fusion) or without MET gene alterations.

