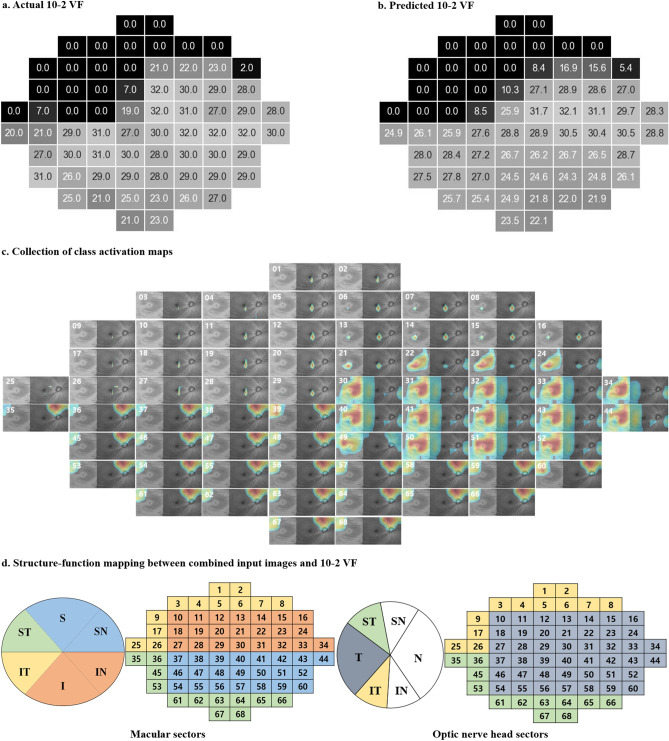
Figure 5.
Representative example of Class Activation Mapping (CAM) with the en face model. Sixty-eight class activation maps were placed at the individual 10-2 visual field (VF) test points (right eye). The figure shows the actual 10-2 VF threshold values (THVs) and the predicted THVs (a, b). Each CAM image is numbered at the top left (c). The red color indicates the region where the deep learning model was highly activated and generated a high sensitivity value for the 10-2 VF test point, whereas the blue color indicates the opposite (c). Structure–function mapping between combined input images (including macula and optic nerve head scan; each in the left column) and 10-2 VF (right column) (d). The macula and optic nerve head sectors and the corresponding 10-2 VF regions are indicated with similar color27. The numbers in the VF images are the same as those in the CAM images.

