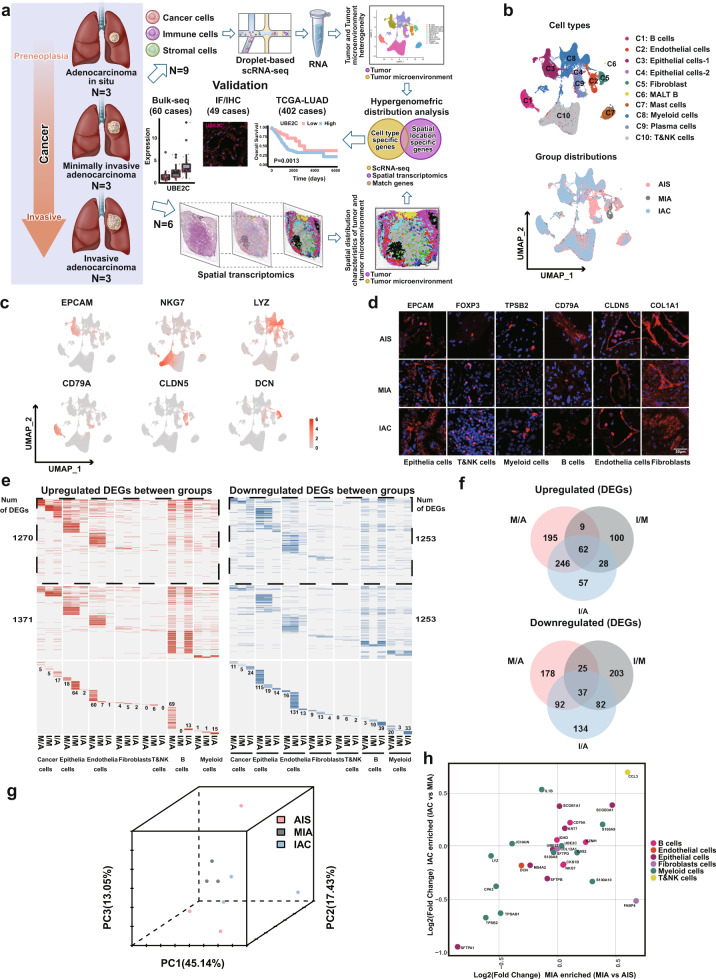
Fig. 1. Research design and main findings of this study.
a The heterogeneity of cancer cells and the TME in early LUAD at three stages (AIS, MIA and IAC) was determined by scRNA-seq. The multicellular spatial environment for each of the three stages was mapped by ST. Hypergeometric distribution analysis was used to integrate cell type-specific and spatial gene expression data obtained by applying scRNA-seq and ST, respectively. Multiple methods were used to validate that the UBE2C cancer cell subcluster and Tregs, NK cells and mast cells in the TME mediate the invasion of early-stage LUAD cells. b UMAP showing classification of scRNA-seq data from 115,246 cells from 9 LUAD patients by cell type (left) and pathological stage (right). c UMAP of scRNA-seq showing six major cell types identified by marker gene expression (EPCAM: epithelial cells; NKG7: NK/T cells; LYZ: myeloid cells; CD79A: B cells; CLDN5: endothelial cells and DCN: fibroblasts). d Protein expression of marker genes determined by IF in six cell types from a TMA consisting of independent LUAD samples (14 AIS cases, 18 MIA cases, 17 IAC cases). e Heatmaps of scRNA-seq showing upregulated DEGs (left panel, red) and downregulated DEGs (right panel, blue) by cell type for the following comparisons: MIA versus AIS (M/A), IAC versus MIA (I/M) and IAC versus AIS (I/A). Genes with nonsignificant changes in expression between the two groups are colored and labeled gray. DEGs shared by at least two cell types are shown in the upper portion of the figure (outlined). The middle portion shows DEGs shared by at least two groups, and the lower portion shows DEGs unique to each cell type in each group. The number of genes is marked in the figure. f Venn diagrams showing the numbers of common upregulated DEGs (upper panel) and downregulated DEGs (right panel) among the three groups. g Principal component analysis (PCA) showing the DEGs among the three groups. The distance between dots represents the difference between groups. h Cell type changes in the three stages of LUAD (the abscissa is MIA vs. AIS, and the ordinate is AIC vs. MIA). The P value was determined using the Wilcoxon-guided cell ratio test.

