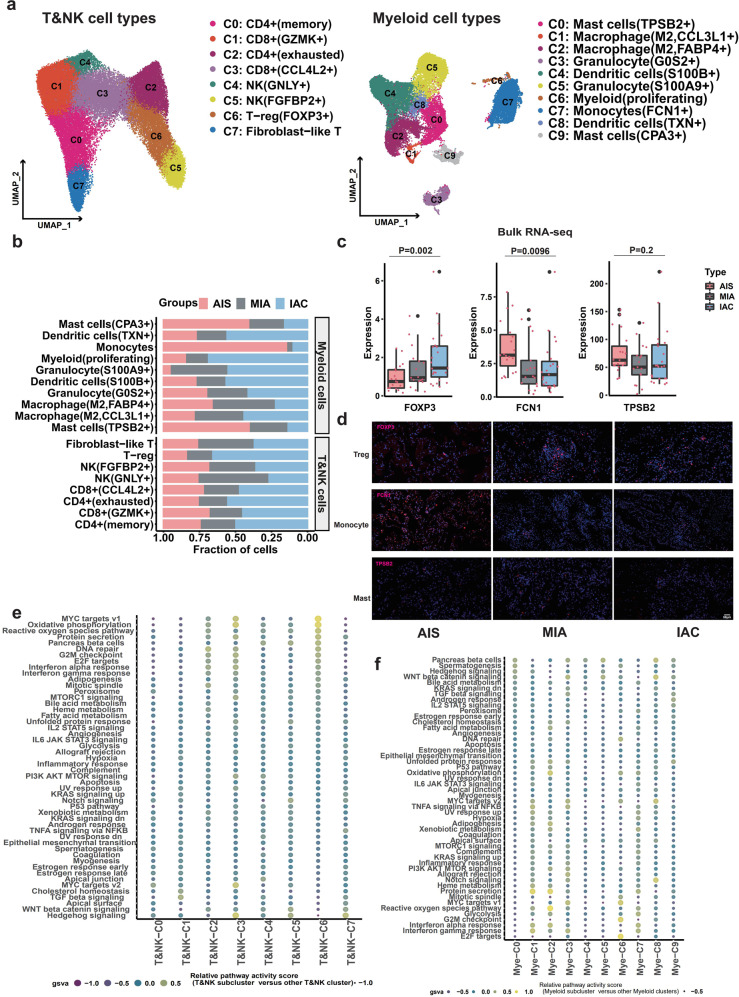
Fig. 4. The role of immune cell infiltration in the early-stage LUAD invasion process.
a UMAP of scRNA-seq showing eight subclusters of T/NK cells (45,612 cells, left) and ten subclusters of myeloid cells (30,627 cells, right). b Proportions of eight subclusters of T/NK cells and ten subclusters of myeloid cells in LUAD samples distributed in three stages. c Bulk RNA-seq confirmed that the expression of the FOXP3 gene (Tregs, left) gradually increased from AIS to MIA to IAC, while the expression of both the FCN1 gene (monocytes, middle) and the TPSB2 gene (mast cells, right) gradually decreased from AIS to MIA to IAC. d IF analysis validated protein expression levels during the LUAD invasion process in TMAs. The protein expression levels of the FCN1 gene (monocytes, middle panel) and TPSB2 gene (mast cells, lower panel) decreased, while those of the FOXP3 gene (Tregs, upper panel) increased from AIS to MIA to IAC. e Heatmap of GSVA results showing differences in pathway activity among different T/NK-cell subclusters (left panel) from scRNA-seq. f Heatmap of GSVA results showing differences in pathway activity among different myeloid cell subclusters from scRNA-seq.

