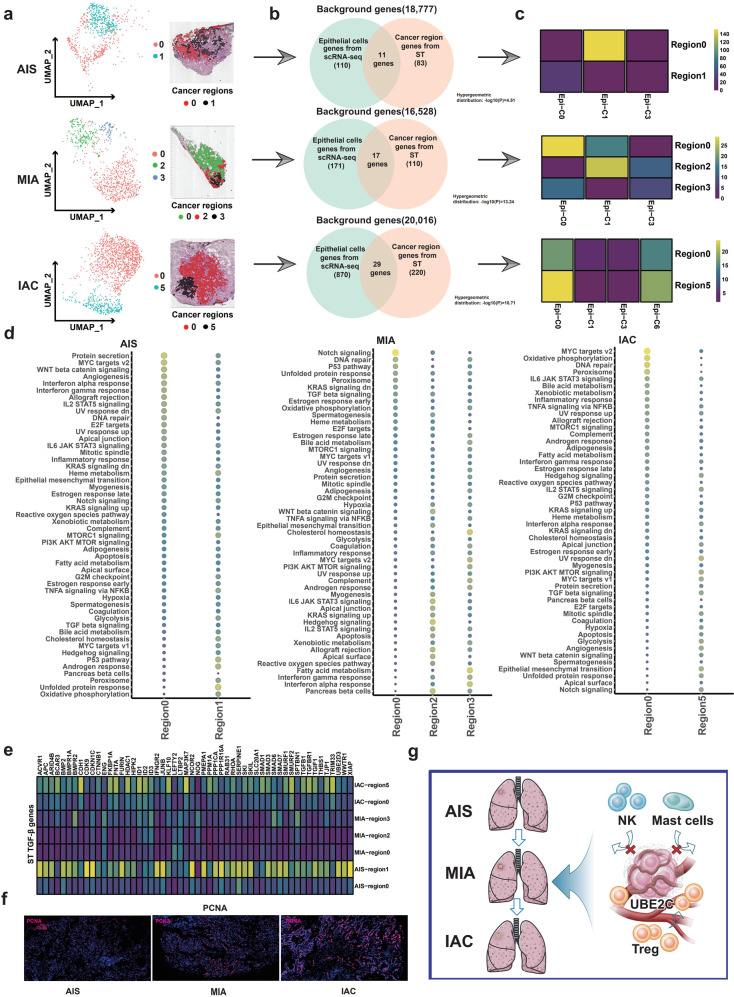
Fig. 7. Spatial heterogeneity of cancer cells.
a ST analysis was used to subregionalize the cancer region in the HE-stained cancer region (upper panel: AIS, TD8; middle panel: MIA, TD3; lower panel: IAC, TD1). b Venn diagram showing overlapping genes specific for cell type of scRNA-seq data and tissue region of ST data from among 33,538 genes. c The hypergeometric distribution method was applied to match the four cancer subtypes identified by scRNA-seq data with the cancer location-specific genes identified by ST data. d Heatmap of GSVA results showing differences in the pathway activity in different spatial cancer subregions (left panel: AIS, TD8; middle panel: MIA, TD3; right panel: IAC, TD1). e GSVA data showing differences in the expression of genes downstream of the TGF-β pathway in cancer cells with different spatial distributions. f IF validated differences in the activity of cancer cells with different spatial distributions (PCNA expression). g Hypothetical models illustrating that the UBE2C + cancer cell subcluster increases and recruits Tregs, repels NK cells and mast cells, and promotes the invasive progression of LUAD from AIS to IAC.

