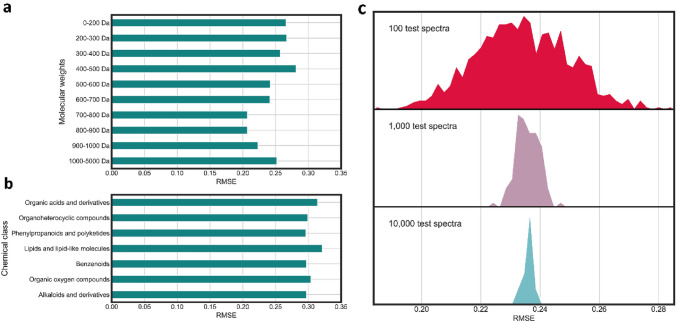
Fig. 4.
Benchmarking of MS2Deepscore with different types of test sets. In all figures the RMSE is determined separately for 10 Tanimoto score bins, followed by taking the average over these 10 bins. a RMSE of MS2Deepscore on test sets with 1500 spectra within a molecular mass range. b RMSE of MS2Deepscore on test sets with 1500 spectra of the most abundant ClassyFire superclasses. c Visualisation of the variance for different test set sizes. This shows there is a substantial difference between smaller test sets of 100 spectra

