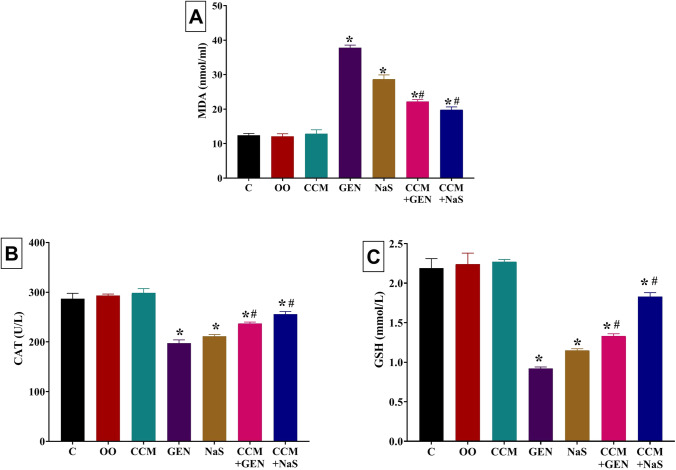
Fig. 2.
Effect of curcumin (CCM) treatment on serum levels of A malondialdehyde (MDA), B catalase (CAT), and C reduced glutathione (GSH) of gentamicin (GEN) or sodium salicylate (NaS) administered rats for 15 days. C, control group; OO, olive oil. Data expressed as mean ± SE, n = 10 for each group. *Significantly different from the control group (i.e., CCM, GEN, NaS, GEN+CCM, or CCM+NaS vs. control group) at P < 0.05. #Significantly different from the respective drug-only-treated group (i.e., CCM+GEN vs. GEN and CCM+NaS vs. NaS) compared to the control group at P < 0.05

