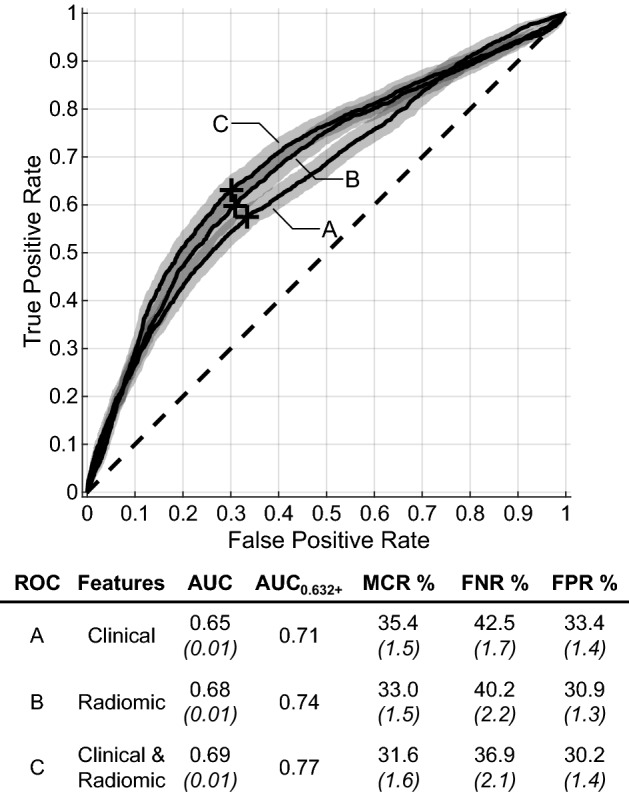
Figure 1.

Comparison of average ROC curves across bootstrapped repetitions when clinical, radiomic, or clinical and radiomic features were used. The AUC for each curve is provided, along with the corrected AUC0.632+ value. The optimal upper-left operating point determined from the out-of-bag dataset is plotted as “+”, for which the MCR, FNR, and FPR were found. A false negative represents a BM that was predicted to respond to SRS, but instead progressed after SRS. 95% confidence intervals are provided for the curves (shaded bands) and error metrics (in parentheses).
