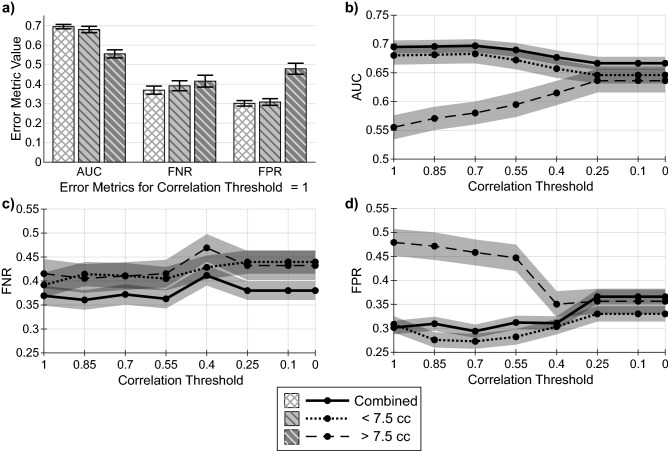
Figure 2.
Volume dependency of error metrics. (a) Shows the comparison of error metrics between all BMs, BMs with volume < 7.5 cc, and BMs with volume > 7.5 cc before the removal of any volume-correlated features. (b–d) show the AUC, FNR, and FPR for each BM volume group as a function of the feature volume-correlation coefficient threshold value used to remove continuous features, with correlation threshold = 1 corresponding to the removal of no features (baseline). At all correlation thresholds < 1, categorical clinical features dependent on BM volume are also removed. For example, values at correlation threshold = 0.7 represent the error metric values when the experiment was repeated with all features with volume-correlation coefficient values greater than 0.7 removed. For all values, a 95% confidence interval is provided by error bars or shaded bands.

