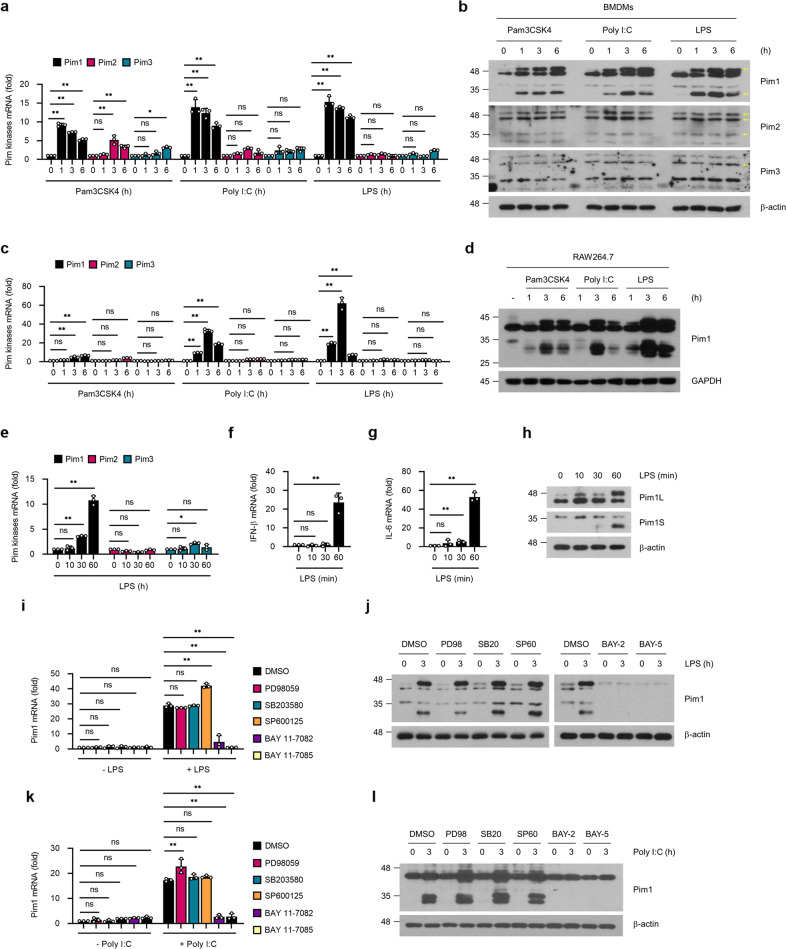
Fig. 1. TLR stimulation induces Pim1 expression in macrophages.
a–d Expression of Pim kinases after TLR stimulation. BMDMs a, b, or RAW264.7 cells c, d were treated with the TLR2 activator Pam3CSK4 (100 ng ml−1), TLR3 activator poly (I:C) (10 μg ml−1) or TLR4 activator LPS (100 ng ml−1) for the indicated times, and Pim kinase expression was determined by RT‒qPCR a, c or immunoblot analysis b, d. The yellow arrows in the immunoblots indicate the Pim isoforms (there are two isoforms, three isoforms, and one isoform of Pim1, Pim2 and Pim3, respectively). e–h Time course of LPS-induced Pim kinase and TLR4 downstream gene expression. BMDMs were treated with LPS (100 ng ml−1) for the indicated times. RT‒qPCR was used to determine Pim kinase e, IFN-β f, and IL-6 g expression. h Immunoblot analysis was conducted to determine the expression of the Pim1L and Pim1S isoforms. i–l Effects of inhibiting specific TLR signaling pathways. BMDMs were preincubated with DMSO, the ERK inhibitor PD98059 (10 μM), the p38 inhibitor SB203580 (10 μM), the JNK inhibitor SP600125 (20 μM), or the NF-κB inhibitor BAY 11-7082 (10 μM) or BAY 11-7085 (10 μM) for 30 min and then treated with LPS (100 ng ml−1) i, j or poly (I:C) (10 μg ml−1) k, l for 3 h. Pim1 expression was determined by RT‒qPCR i, k or immunoblot analysis j, l. All mRNA expression values were normalized to β-actin mRNA expression. All data are expressed as the mean ± sd values and are from at least two independent experiments with similar results. *p < 0.05, **p < 0.01 as determined by two-tailed Student’s t test.

