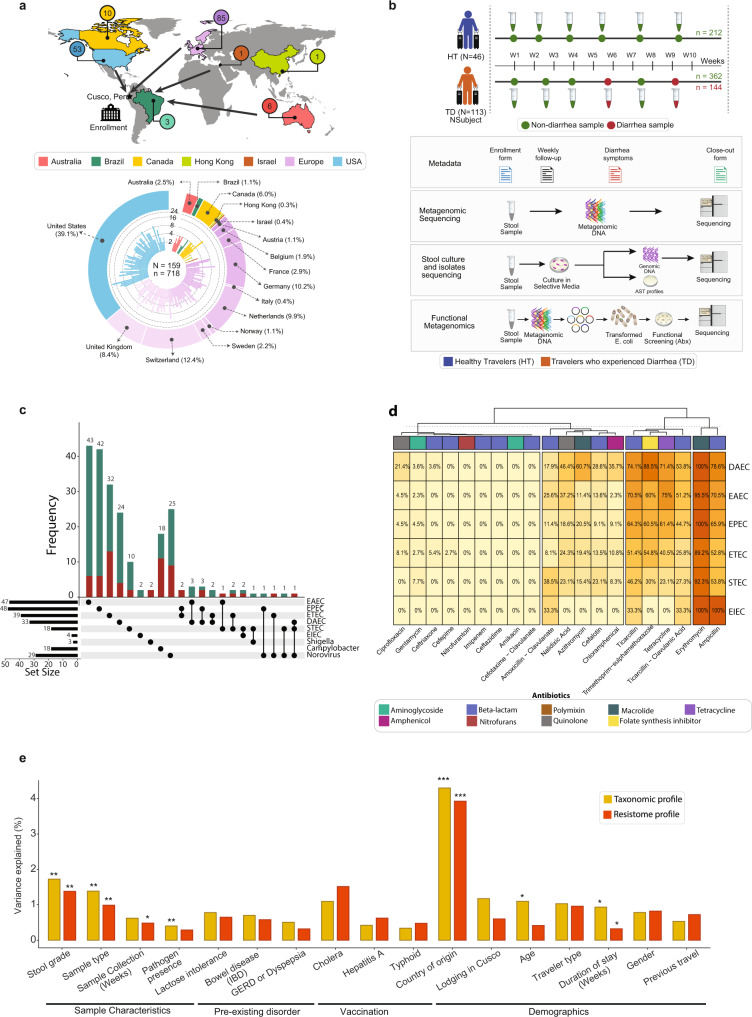
Fig. 1. Study design, data assembly, and meta-analysis for cohort of international travelers.
a Highlighted regions of the map show countries of residence for travelers in our cohort who visited the Andean city of Cusco, Peru between June 2012 and July 2016. Most traveled from North America or the European subcontinent. The Circos plot at the bottom shows the distribution of samples collected per individual, color-coded by their country of residence. b Sampling strategy and experimental design: Subjects who did not experience diarrhea during course of stay were classified as Healthy Travelers (HT, blue), while those who experienced at least one episode of diarrhea were classified as Travelers with Diarrhea (TD, orange). Collected stool samples were processed to obtain taxonomic, and resistome profiles using metagenomics sequencing. A subset of samples were cultured to obtain suspected diarrheagenic pathogens, tested for antibiotic susceptibility, and sequenced for detailed comparative genomic analysis. Additionally, functional metagenomics libraries were prepared and screened against 17 antibiotics to characterize resistomes in the stool samples. c Upset plot depicting the frequency of diarrheagenic pathogens that were detected using multiplex PCR in non-diarrhea (green) and diarrhea samples (red). d Antibiotic susceptibility testing of diarrheagenic E. coli isolates against 20 antibiotics. Percentage and coloring of heatmap shows the proportion of isolates in a DEC pathotype resistant to the given antibiotic, with colored bar indicating antibiotic class. d PERMANOVA test quantifying the total variance explained by metadata variables in the taxonomic (MetaPhlAn217) and resistome (ShortBRED18) profiles. The y axis indicates the total variance explained and the x axis represents different metadata variables that were tested (*P < 0.05; **P < 0.01; ***P < 0.001). Underlying data are provided in the Source Data file.

