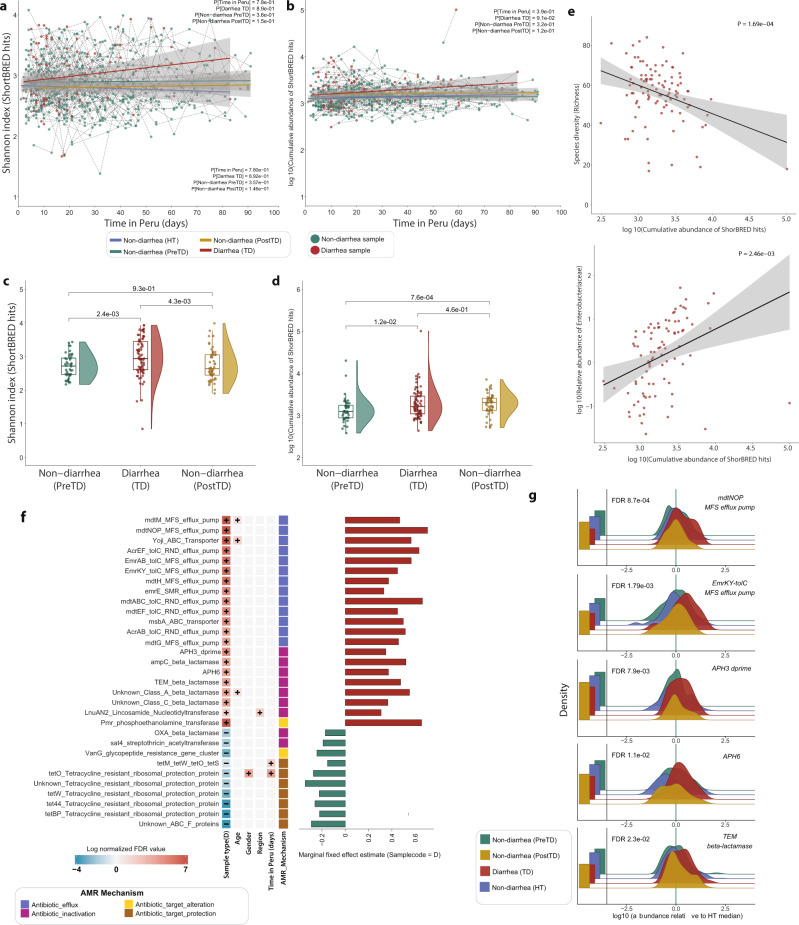
Fig. 4. Diarrhea increases ARG diversity and abundance.
a The alpha diversity (Shannon index) of subjects’ resistomes throughout the length of their time in Peru, as days post-arrival. Points are individual fecal samples, colored by sample type (i.e., diarrhea or non-diarrhea), with dotted lines connecting samples from the same subject. Solid lines show the best fit for different traveler types: HT (blue), diarrheal (red), non-diarrheal pre-TD (green), and post-TD samples (yellow) (n = 617, LMM, P > 0.05) and the gray shading represents 95% confidence interval (CI). b Cumulative abundance of ARGs (log10 scale) over time. Points are individual samples with dotted lines connecting samples from the same subject. Solid lines show best fit with 95% CI (gray shading) of samples from different traveler types (n = 617, LMM, P > 0.05). c Boxplots of ARG diversity (Shannon index) of subject-matched diarrheal samples with non-diarrheal samples collected within 2 weeks of diarrhea. Accompanying violin plots show the distribution (n = 171 samples, two-sided Wilcoxon test). d Cumulative abundance of ARGs of subject-matched diarrheal samples with non-diarrheal samples collected within 2 weeks of diarrhea. Accompanying violin plots show the distribution (n = 171 samples; two-sided Wilcoxon test). e Correlations between cumulative abundance of ARGs (log10 scale) and microbial species diversity (top) and relative abundance of Enterobacteriaceae (log10 scale) (LMM; all P < 0.001). f ARGs that enriched or depleted in diarrheal samples compared to non-diarrheal samples. The significant associations were detected by MaAsLin227 where other metadata variables (age, sex, sample type, region, length of stay, and antibiotics usage) were used as fixed effects in the LMM. g Relative abundance distribution of differentially abundant ARGs in different sample types normalized by the median relative abundance of non-diarrheal HT samples (LMM; all P < 0.001). Left barplot, fraction of samples below detection limit. Boxes in the boxplots show median and quartiles; error bars extend to the values within 1.5 interquartile range. P values are multiple-hypothesis test corrected using Benjamini–Hochberg (FDR) method. Underlying data are provided in the Source Data file.

