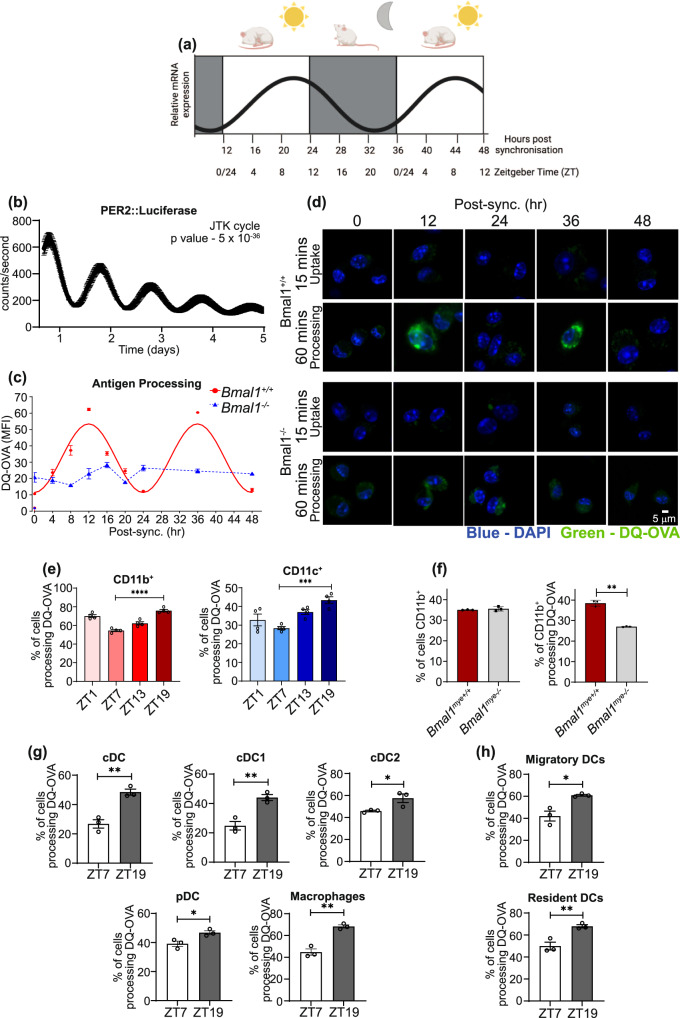
Fig. 2. Dendritic cells display robust circadian rhythms in antigen processing.
a A schematic summarising how ZT time can be inferred from the in vitro synchonised serum shock model comparing Per2 mRNA oscillation in BMDCs. Shading represents the relative active periods. As mice are nocturnal, 12 h post synchronisation represents ZT0 the onset of the inactive phase, whereas 24 h post synchronisation represents ZT12 the onset of the active phase. b Per2::luciferase BMDCs were synchronised by serum shock and circadian rhythms were measured using lumicycle technology (n = 3 biologically independent samples). Bmal1+/+ and Bmal1−/− BMDCs were synchronised and antigen processing was measured at c 4 h or d 12 h intervals over a 48 h time course (n = 3 independent experiments). Antigen processing was measured by addition of DQ-OVA (1 µg/mL) and fluorescence (blue – DAPI, green – DQ-OVA) was measured at 15 min (uptake) or 60 min (processing) and then fixed and analysed by confocal microscopy. e Spleens were isolated from WT mice at ZT1, ZT7, ZT13 and ZT19 and single cell suspension generated, stained for DQ-OVA (1 μg/mL) as in (c, d) and subsequently stained for CD11b+ and CD11c+ and analysed by flow cytometry (n = 4 mice). f Spleens isolated from Bmal1myeloid+/+ and Bmal1myeloid−/− mice and stained for DQ-OVA as in (c, d) and CD11b+ and analysed by flow cytometry (n = 3 mice) p = 0.0045. g, h Splenic DCs were expanded by B16-FLT3L cells. g cDCs, cDC1s, cDC2s, plasmacytoid DCs and macrophages, or h migratory and resident DCs were identified by flow cytometry and DQ-OVA processing quantified by flow cytometry (n = 3–4 mice). cDC p = 0.003, cDC1 p = 0.005, cDC2 p = 0.04, pDC p = 0.02, macs p = 0.001, migratory DCs p = 0.01, resident DCs p = 0.0092 Data shown is mean with error bars representing ± SEM. Luciferase data was analysed for circadian rhythmicity by JTK cycle (b). Antigen processing in Bmal1+/+ was predicted to be circadian by cosinor analysis (c). Data were compared by one-way ANOVA with Tukey’s post-hoc test for multiple comparisons (e) or by a two-tailed t-test (f–h). *p < 0.05, **p < 0.01, ***p < 0.001 and ****p < 0.0001. Source data are provided as a Source Data file.

