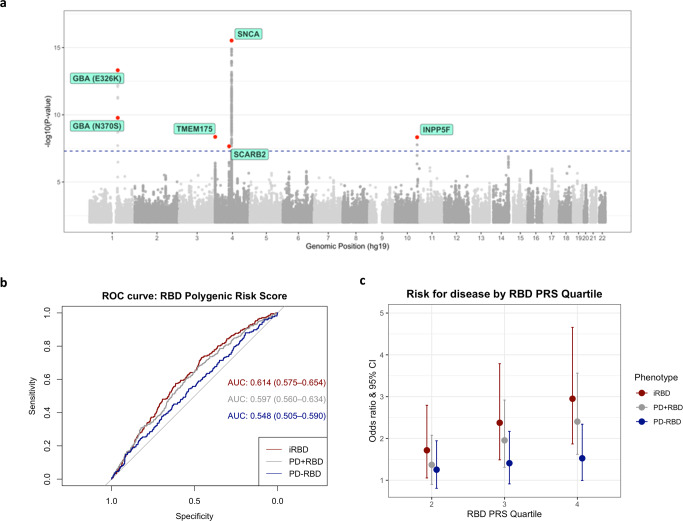
Fig. 1. Summary of GWAS findings in the RBD meta-analysis. Manhattan plot.
ROC receiver operating characteristic, iRBD idiopathic REM sleep behavior disorder, PRS polygenic risk score, PD Parkinson’s disease, pRBD probable RBD. a The Manhattan plot highlights the 6 GWAS-nominated loci after meta-analysis. GWAS was performed as repeated logistic regression across the genome, adjusted for age, sex, and principal components. Each point represents the log adjusted p-value at each genomic site. A locus was considered significant if the two-sided p-value was less than the corrected GWAS-significant p-value threshold of 5E-08, visualized in this plot with the dashed line. The points in red show the top variant at that locus, as well as any secondary independent associations. Predictive power of RBD polygenic risk score. Polygenic risk scores for RBD were calculated using FDR-corrected GWAS variants (N SNPs = 47) in 3 cohorts: idiopathic RBD, PD+pRBD, and PD–pRBD, each with controls. b The predictive power of the PRS in each cohort was assessed with area under the curve (AUC) and 95% confidence intervals. c The PRS for each cohort were divided in quartiles and analyzed against case status with logistic regression (N iRBD = 212 with N controls = 1265; N PD+pRBD = 285 with N controls = 907; N PD–pRBD = 217 with N controls = 907). The odds ratios and 95% confidence intervals (the odds ratio +/− 1.96*standard error) are visualized here as compared to the lowest quartile (the lowest 25% of scores).

