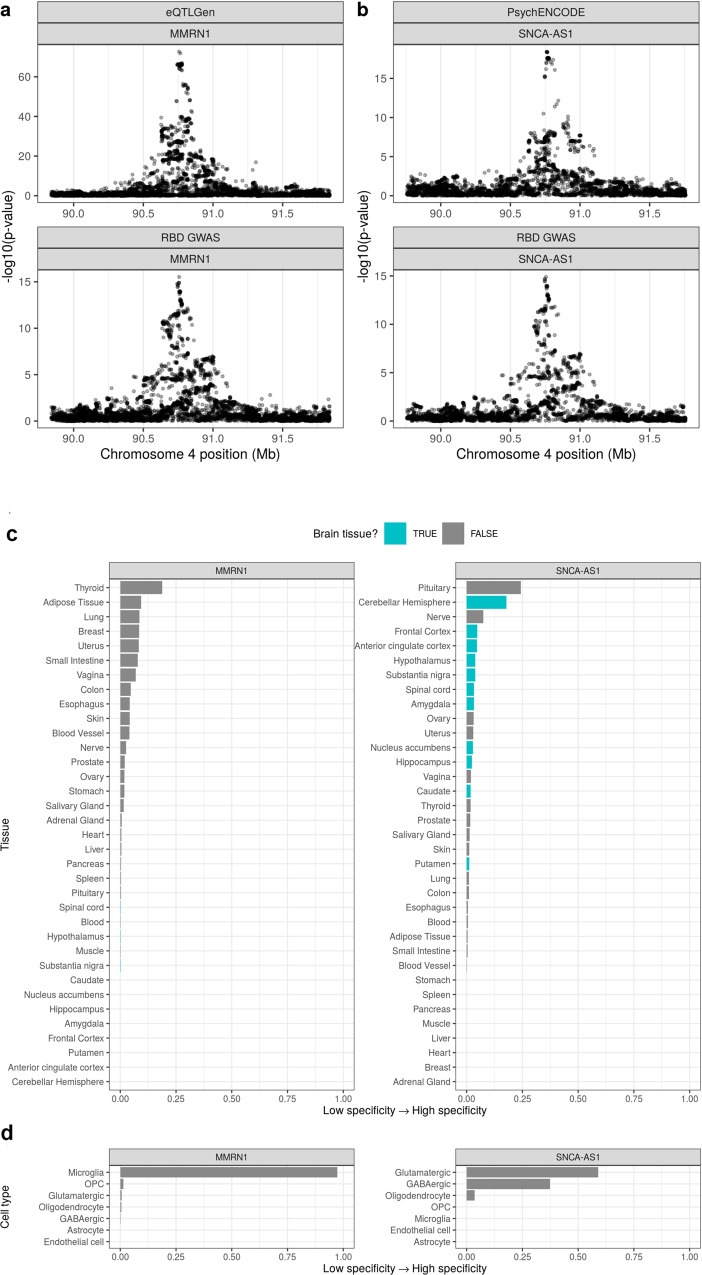
Fig. 2. Regional association plots for eQTL and RBD GWAS colocalizations and tissue and cell-type specificity of MMRN1 and SNCA-AS1.
RBD REM sleep behavior disorder, GWAS genome-wide association study. Regional association plots for eQTL (upper pane) and RBD GWAS association signals (lower pane) in the regions surrounding a SNCA-AS1 (colocalization PPH4 = 0.89) and b MMRN1 (colocalization PPH4 = 0.86). eQTLs are derived from a PsychENCODE’s analysis of adult brain tissue from 1387 individuals or b the eQTLGen meta-analysis of 31,684 blood samples from 37 cohorts. In a and b, the x-axis denotes chromosomal position in hg19, and the y-axis indicates association p-values from across-locus logistic (RBD GWAS) or linear (eQTL) regression on a –log10 scale. Plot of SNCA-AS1 and MMRN1 specificity in c 35 human tissues (GTEx dataset) and d 7 broad categories of cell type derived from human middle temporal gyrus (AIBS dataset). Specificity represents the proportion of a gene’s total expression attributable to one cell type/tissue, with a value of 0 meaning a gene is not expressed in that cell type/tissue and a value of 1 meaning that a gene is only expressed in that cell type/tissue. In c tissues are colored by whether they belong to the brain. In c and d, tissues and cell types have been ordered by specificity from high to low.

