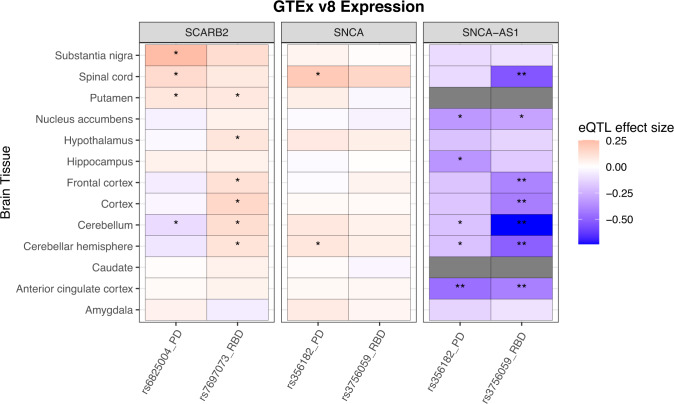
Fig. 3. eQTL data from GTEx version 8 for RBD and PD top variants in differing loci.
GTEx Genotype-Tissue Expression Consortium, v8 version 8, RBD REM sleep behavior disorder, PD Parkinson’s disease, eQTL expression quantitative trait loci. All data was extracted from the GTEx online portal (https://www.gtexportal.org/). The effect sizes represent the slope of linear regression on normalized gene expression data versus the genotype status using single-tissue eQTL analysis, performed by the GTEx consortium. Nominal associations are indicated with* (p < 0.05) while FDR-corrected significant associations are indicated with**. FDR correction q-values were calculated using beta distribution-adjusted empiracle p-values, derived from adaptive permutations during eQTL mapping. Dark gray indicates missing data in these tissues. The RBD SNCA variant correlates most strongly with decreased SNCA-AS1 expression in the cerebellum (uncorrected p = 9.9e-19) cerebellar hemisphere (p = 3.1e-08), cortex (p = 1.9e-05), frontal cortex (p = 6.3e-05), and anterior cingulate cortex (p = 2.6e-04). The PD variant only significantly correlates with decreased expression in the anterior cingulate cortex (p = 2.5e-05).

