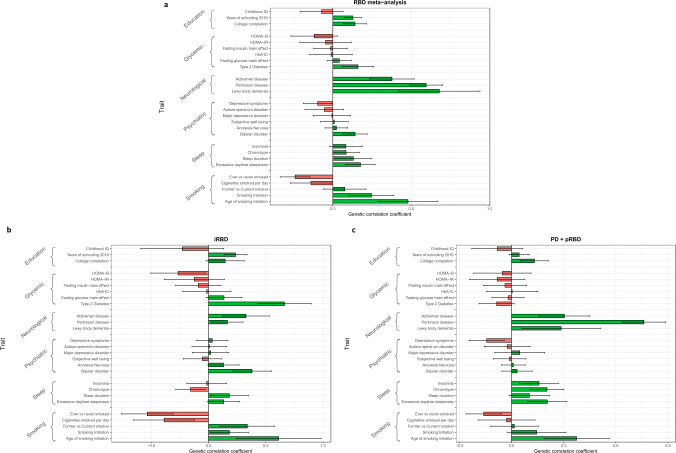
Fig. 6. Genetic correlation results.
RBD REM sleep behavior disorder, PD Parkinson’s disease, pRBD probable REM sleep behavior disorder. Genetic correlation was calculated using LD-score regression for a the RBD meta-analysis (N cases = 2843 and N controls = 139,636), b isolated RBD (iRBD) alone (N cases = 1061 and N controls = 8386), and c PD+pRBD alone (N cases = 1782 and N controls = 131,250). The traits tested are organized in their general categories as labeled by LD Hub. The error bars represent the genetic correlation coefficient +/– the standard error, centered on the correlation coefficient.

