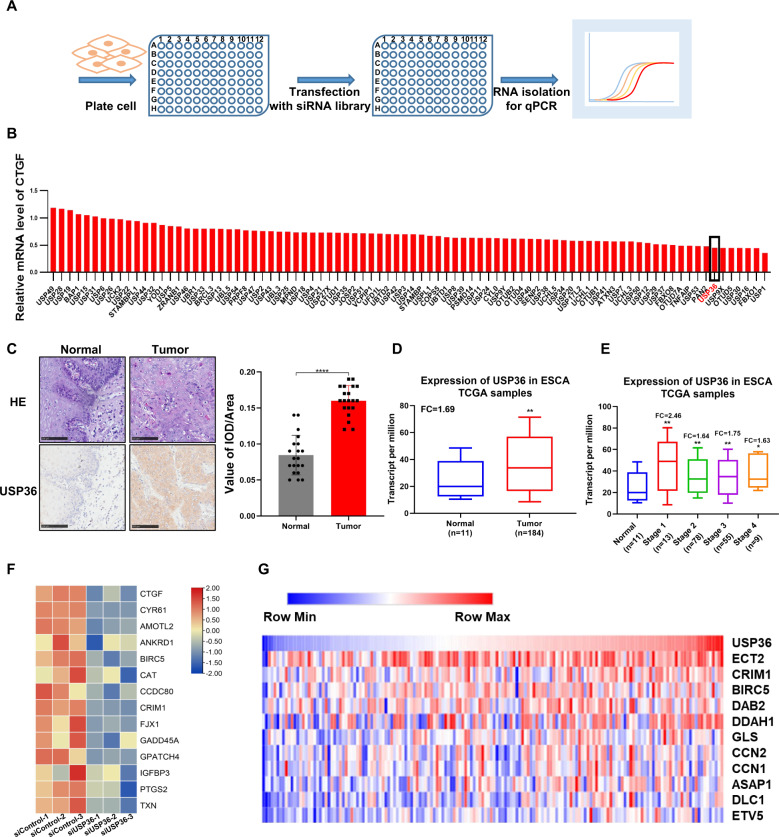
Fig. 1. The possible regulation between USP36 and Hippo pathway in ESCC.
A Diagram of the screening procedure used to identify deubiquitinases that modulate Hippo signaling in HEK293 cells. B The relative expression level of CTGF(NM_001901.4) in HEK293 cells transfected with deubiquitinases in the screening library. The RT-qPCR results were normalized to 1. USP36 is marked in red. C USP36 expression was markedly increased in 20 ESCC tissues compared with adjacent nontumor tissues as analyzed by IHC. Scale bar, 100 µm. Integrated optical density (IOD) values for IHC staining between normal and tumor tissues are presented in the histogram. USP36 antibody was verified for IHC by immunofluorescence in Supplementary Fig. 1A. D The expression level of USP36 in ESCC tumor samples versus normal samples in TCGA was shown in the histogram. E Expression of USP36 in ESCC between normal tissues and tumors tissues of different stages is presented in the histogram. F The heatmap showed differentially expressed Hippo pathway-related genes whose expression was seriously decreased by siUSP36 in ECA109 cells. G Heatmap for USP36 and Hippo signaling pathway target gene expression in TCGA ESCC datasets (in the diagram, red denotes high gene expression levels, blue denotes low gene expression levels). The quantification of the positive correlation between USP36 and the YAP and TAZ target genes is shown in Supplementary Fig. 1D. ****P < 0.0001.

