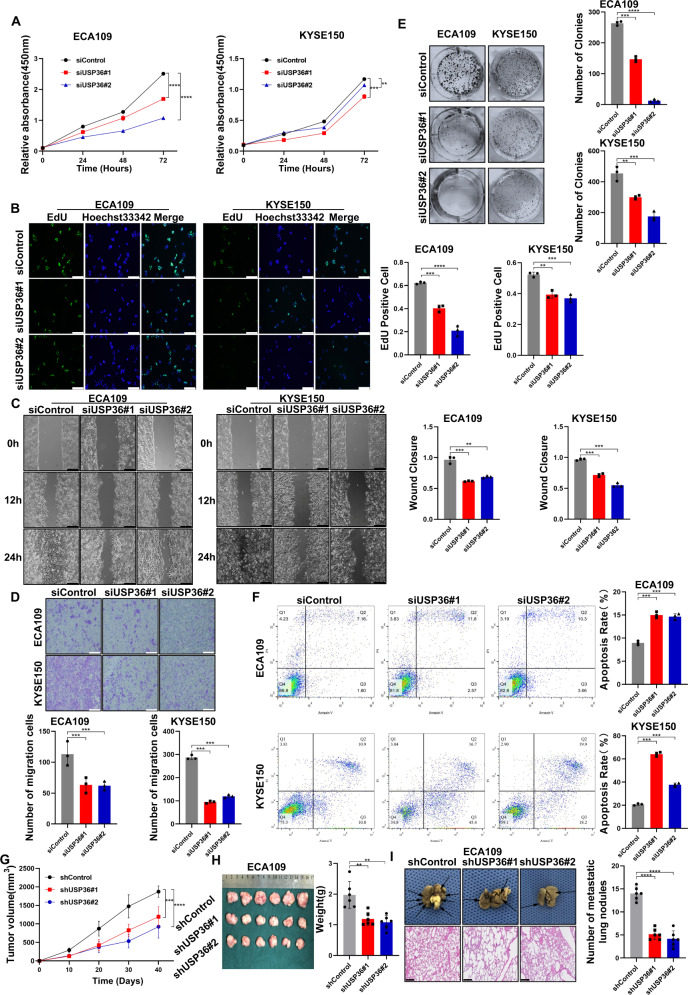
Fig. 3. USP36 depletion inhibited ESCC cell progression via Hippo/YAP signaling.
A Cell viability was determined by CCK8 assay in ESCC cell lines transfected with siControl or two independent USP36 siRNA. CCK-8 assay showed that USP36 depletion inhibited the proliferation of ECA109 and KYSE150 cells. B EdU assay to show the cell proliferation of ESCC cell lines transfected with siControl or two independent USP36 siRNA. ECA109 and KYSE150 cells were labeled with EdU. Right panel showed the quantification of EdU results. Green showed EdU-positive cells; blue showed cell nuclei; scale bar, 250 µm. C Wound healing assay of ESCC cell lines migration capability following transfected with siControl or two independent USP36 siRNA. The migration assay showed that depletion of USP36 suppressed the migration of ECA109 and KYSE150 cells. Scale bar, 250 µm. Right panel showed quantification of wound healing results. D Transwell assay of ECA109 and KYSE150 cells transfected with siControl or two independent USP36 siRNA, respectively. Depletion of endogenous USP36 markedly decreased cell migration. Right panel showed the quantification of transwell assay results. Scale bar, 250 µm. E Colony formation of ECA109 and KYSE150 cells transfected with siControl or two independent USP36 siRNA, respectively, showed that USP36 depletion inhibited proliferation. Right panel showed quantification of colony formation assay results. Scale bar, 250 µm. F Representative plots (left panel) of apoptosis ECA109 and KYSE150 cells transfected with siControl or two independent USP36 siRNA, respectively. USP36 depletion promoted the apoptosis of ECA109 and KYSE150 cells. Quantitative summary (right panel) of apoptosis analysis of FACS. G Quantitative tumor volumes from NSG mice injected with control or USP36-depleted ECA109 cells were measured at indicated time points. Representative image is in Fig. S2J. H Representative image of tumor derived from NSG mice injected with control or USP36-depleted ECA109 cells was followed as indicated. Right panel showed quantitative tumor weight of tumors. I Representative image of in vivo lung metastasis of indicated ECA109 cells were indicated. The black arrow denoted a pulmonary metastatic nodule. Right panel showed quantitative analysis of tumor metastasis. Scale bar, 250 µm. **P < 0.01, ***P < 0.001, ****P < 0.0001.

