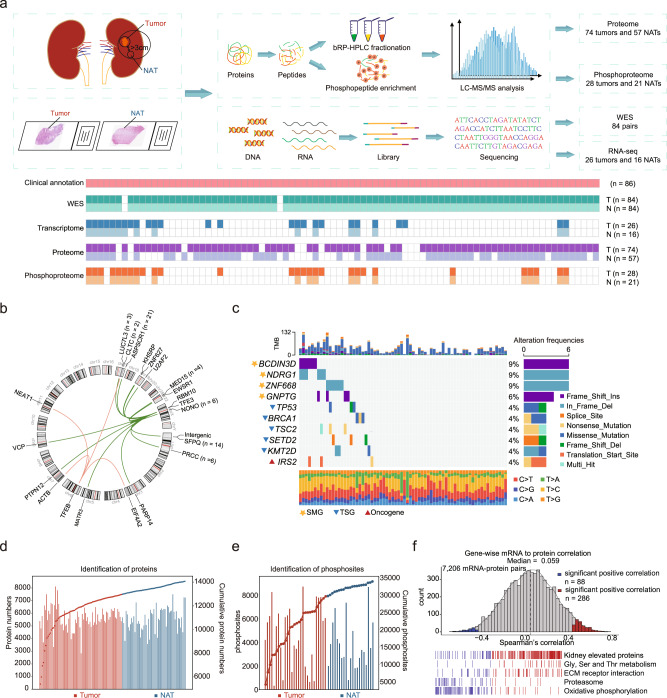
Fig. 1. Molecular profiling of MiT family tRCC.
a Schematic representation of tRCC multiomics analyses, including WES, RNA-seq, proteomics, and phosphoproteomics. b Circos plot showing the TFE3/TFEB gene fusion events. c Genomic profile of 70 tRCC tumors with somatic mutations. SMGs, TSGs, and oncogenes are noted by different shapes. d Overview of proteomic profiles of tRCC samples. e Overview of phosphoproteomic profiles of tRCC samples. f Gene-wise mRNA-protein correlation and functional enrichment.

