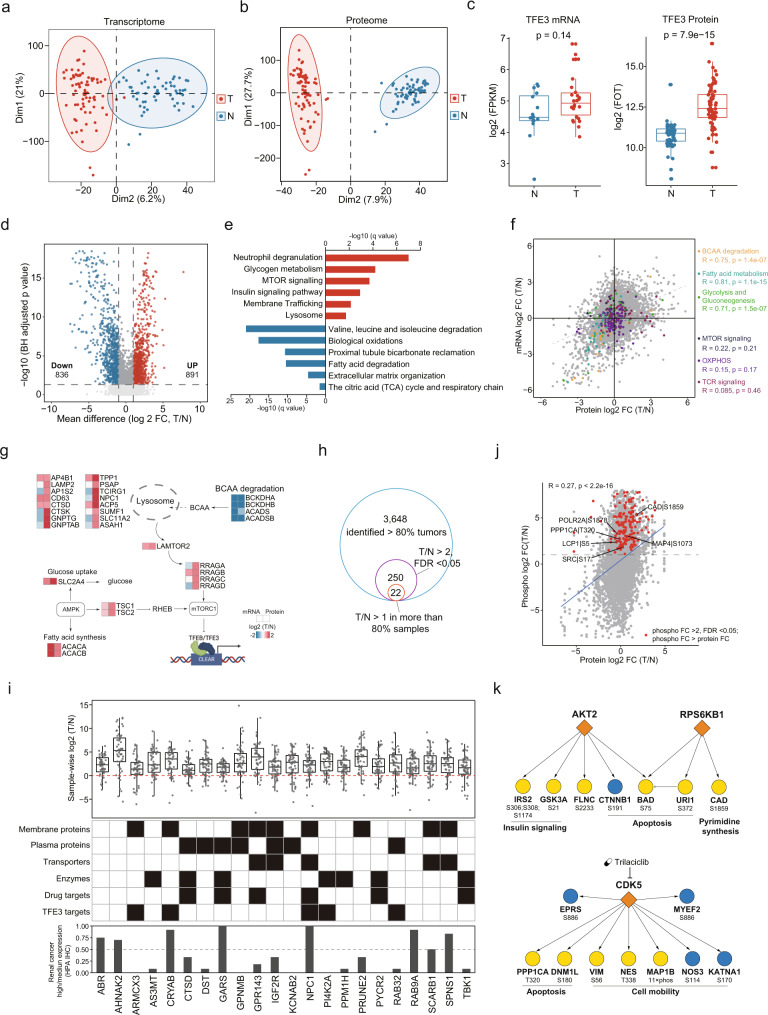
Fig. 2. Molecular alterations in tRCC tumors compared to adjacent tissues.
a–b Global transcriptome and proteome PCA plots. Red, tumor; Blue, NATs. c Boxplots of TFE3 gene product levels displaying discordant mRNA (N, n = 16; T, n = 26)-protein (N, n = 57; T, n = 74) expression. Boxplots show the median (central line), the 25–75% interquartile range (IQR) (box limits), the ±1.5 × IQR (whiskers). P values are derived from two-sided Wilcoxon rank-sum test. d Volcano plot showing DEPs (Benjamini–Hochberg-adjusted p value < 0.05, FC > 2) in tumor and normal adjacent tissues. e DEPs in tumors and adjacent tissues, and their enriched biological pathways. f Scatterplots depicting expression of mRNA (x axis) and protein (y axis). Genes involved in BCAA degradation, Fatty acid metabolism, Glycolysis and Gluconeogenesis, MTOR signaling, OXPHOS, and TCR signaling were indicated by different colors. g Schema of uncoupling of MTOR pathways at mRNA and protein levels. h The pipeline for tRCC biomarker identification. i Log2-fold-change between tumor and matched NATs (n = 54) is shown for the 22 tRCC biomarkers. Boxplots show the median (central line), the 25–75% IQR (box limits), the ±1.5 × IQR (whiskers). These biomarkers are annotated with potential clinical utilities and IHC staining scores defined by HPA. j Comparison of abundance changes between phosphosites and their corresponding proteins. Red points indicate the phosphosites with >2-fold increase (Benjamini–Hochberg adjusted p < 0.05) and change stronger than in the corresponding protein. Phosphosites with functional annotations are indicated. k The kinase-substrate links of significantly activated kinases (at both protein abundance and kinase activity).

