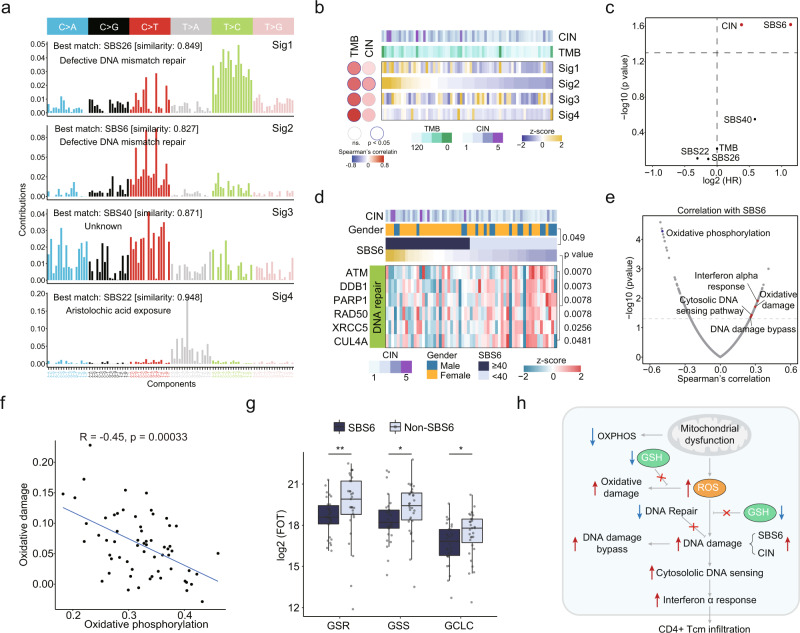
Fig. 3. Identification of mutational signatures and associated signaling pathways.
a Decomposition of four mutational signatures from the tRCC cohort. b Correlations between mutational signatures and TMB and CIN. c Cox regression analysis of TMB, CIN, and mutational signatures. d Heatmap showing differentially expressed DNA repair molecules between tRCC with and without SBS6 (two-sided Wilcoxon rank-sum test). e Scatter plot showing the correlation of SBS6 and Wikipathway ssGSEA scores. f Wikipathways oxidative damage and oxidative phosphorylation shows a strong negative correlation. g Relative protein abundance in SBS6 (n = 30) and non-SBS6 (n = 31) groups for ROS defense proteins GSR (**p = 0.0065), GSS (*p = 0.019), and GCLC (*p = 0.044). Boxplots show the median (central line), the 25–75% IQR (box limits), the ±1.5 × IQR (whiskers). P values are derived from two-sided Wilcoxon rank-sum test. GSR Glutathione-Disulfide Reductase, GSS Glutathione Synthetase, GCLC Glutamate-Cysteine Ligase Catalytic Subunit. h Schematic representation of the molecular features of tRCC with SBS6 signature.

