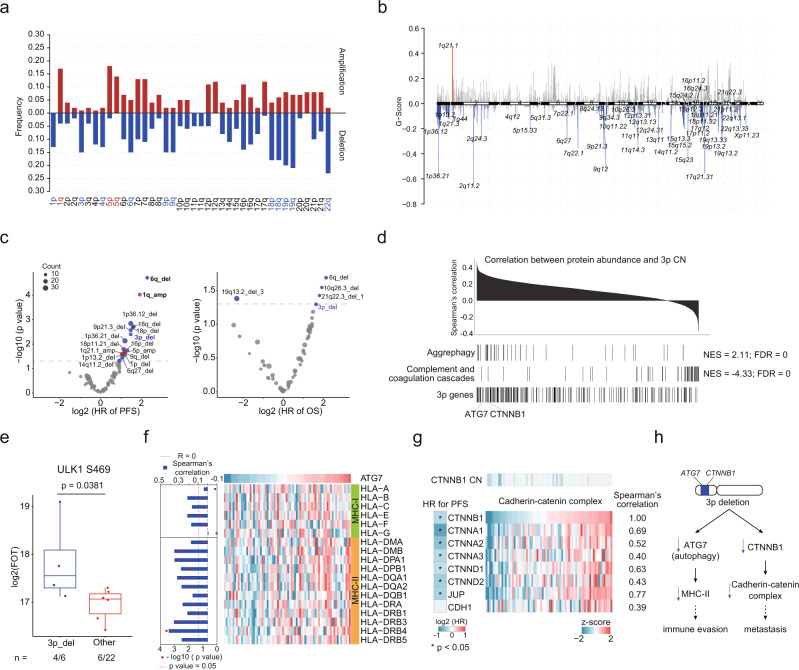
Fig. 4. Somatic copy number alteration analysis in tRCC cohort.
a Arm-level SCNA events. Red denotes amplification and blue denotes deletion. Significant events are highlighted using red and blue (q < 0.10). b Focal SCNA events. Focal peaks with significant copy number amplifications (red) and deletions (blue) (q < 0.05) are shown. c Cox regression analysis of significant arm-level CNA and focal CNA events. d Identifying cis- and trans-effect of 3p deletion. Proteins are ranked based on the correlation between protein abundance and 3p CN. e Trans-effect of 3p deletion on ULK1 S469 phosphorylation level. Boxplots show the median (central line), the 25–75% IQR (box limits), the ±1.5 × IQR (whiskers). P value is derived from two-sided Wilcoxon rank-sum test. f Correlations between ATG7 protein abundance and MHC molecules. g Cis and trans- effects of CTNNB1 deletion on cadherin-catenin complex abundances. Cox regression analysis of cadherin-catenin complex abundances are shown in left. h A model depicting the association of 3p deletion and poor prognosis in tRCC.

