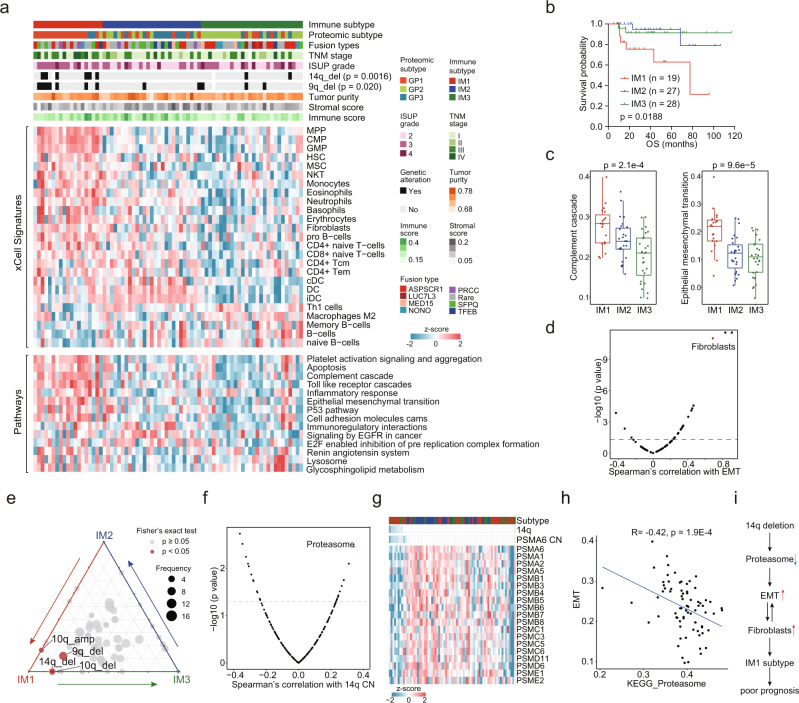
Fig. 7. Immune infiltration of tRCC tumors.
a Relative abundances of upregulated proteins in the three immune subtypes and associations of immune subtypes with clinical and genetic features and proteomic subtypes (Fisher’s exact test). b Kaplan–Meier curves of OS for the three immune subtypes (two-sided log-rank test). c Comparison of pathway scores for the Complement Cascade and EMT among immune subtypes (IM1, n = 19; IM2, n = 27; IM3, n = 28). Boxplots show the median (central line), the 25–75% IQR (box limits), and the ±1.5 × IQR (whiskers). P values are derived from Kruskal–Wallis test. d Scatter plot showing the correlation of EMT scores and xCell immune signatures. Fibroblasts are indicated. e Ternary plot showing the distribution of significant arm-level events in the three immune subtypes. CNA events with significant differences among three subtypes are indicated (Fisher’s exact test). f Proteasome showing the highest correlation with 14q CN. g Cis and trans-effects of 14q deletion on proteasome. h Correlation of proteasome scores and EMT scores (two-sided Spearman’s correlation test). i A model depicting the association of 14q deletion and immune signature in tRCC.

