
FIGURE 7.
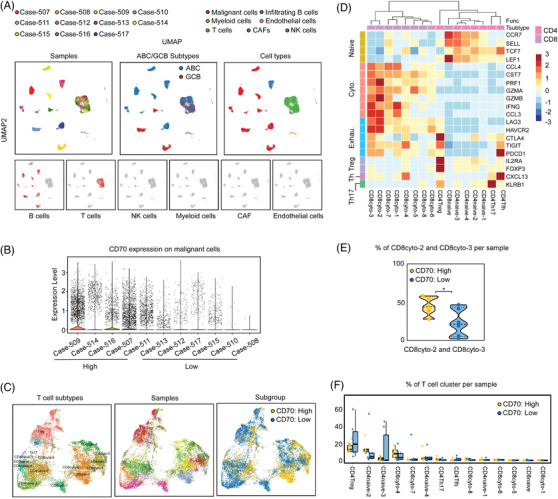
Single‐cell RNA sequencing revealed T‐cell exhaustion in diffuse large B‐cell lymphoma (DLBCL) with high levels of CD70. (A) Single‐cell RNA sequencing analyses of 11 DLBCL samples. Uniform manifold approximation and projection (UAMP) plot showing the sample origins and DLBCL subtypes of each cell cluster (left and middle panels). Clusters were assigned to the indicated cell types by canonical markers (right panel). CAFs, cancer‐associated fibroblasts. NK cells, natural killer cells. (B) Quantification of CD70 on the malignant B cells of each sample. Samples were grouped (low and high) based on the CD70 expression on malignant B‐cells. (C) UAMP plot showing T‐cell subclusters (left panel). Sample origins are indicated in the middle panel. Subclusters were assigned to CD70 high and low groups based on the CD70 expression on the corresponding malignant B cells (right panel). (D) Expression of functional status markers of T cells. (E) The percentages of CD8cyto‐2 and CD8cyto‐3 cells per sample are shown. *P = 0.0495, one‐tailed Mann–Whitney U‐test. (F) The percentages of T cells per sample are shown for the indicated subcluster. Not significant, one‐tailed Mann–Whitney U‐test.