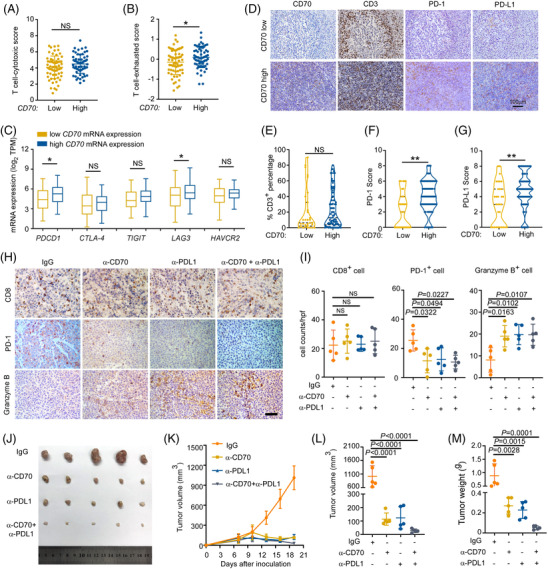
FIGURE 8.

CD70/CD27 and PD‐1/PD‐L1 coinhibition rescues T‐cell exhaustion and reduces lymphoma growth in vivo. (A,B) T‐cell‐cytotoxic score and T‐cell‐exhausted score (calculated based on transcriptomic data) for diffuse large B‐cell lymphoma (DLBCL) patients with low (n = 64) and high (n = 63) CD70 mRNA expression, Student's t‐test; ns, not significant. (C) The mRNA expression of PDCD1, CTLA‐4, TIGIT, LAG3 and HAVCR2 in DLBCL patients with low (n = 64) and high (n = 63) CD70 mRNA expression; the fold changes in the mRNA expression of PDCD1 and LAG3 were 1.9 and 1.3, respectively. Student's t‐test, PDCD1: P = 0.0242; LAG3: P = 0.0223; ns, not significant. (D) Representative immunohistochemical (IHC) images of CD70, CD3, PD‐1 and PD‐L1 in DLBCL patients. Original magnification, 20×; scale bar, 100 μm. (E) CD3+ T‐cell infiltration was similar between the different CD70 expression groups. n = 115. Student's t‐test; NS, not significant. (F) PD‐1 expression was higher in the high CD70 group. n = 115. Mann–Whitney U‐test, **P = 0.0004. (G) PD‐L1 expression was higher in the high CD70 group. n = 114. Mann–Whitney U‐test, **P = 0.0030. (H–M) A20 lymphoma cell‐bearing BALB/c mice were treated with isotype control antibody or the indicated blocking antibody every three days, starting 7 days after inoculation. n = 5 mice/group. (H) Representative IHC staining for CD8, PD‐1, and granzyme B in tumour tissues from the indicated treated groups. Original magnification, 40×; scale bar, 50 μm. (I) CD8+ T‐cell counts (left panel), PD‐1+ (middle panel) and granzyme B+ cell (right panel) numbers under a 40× field for the indicated groups. One‐way ANOVA with Tukey's test; NS, not significant. (J) When the mice were sacrificed, the tumours were harvested. (K,L) Tumour volumes were monitored every 3 days and calculated as the length×width2×0.5. One‐way ANOVA with Tukey's test. (M) The tumour weight in the indicated groups. One‐way ANOVA with Tukey's test.
