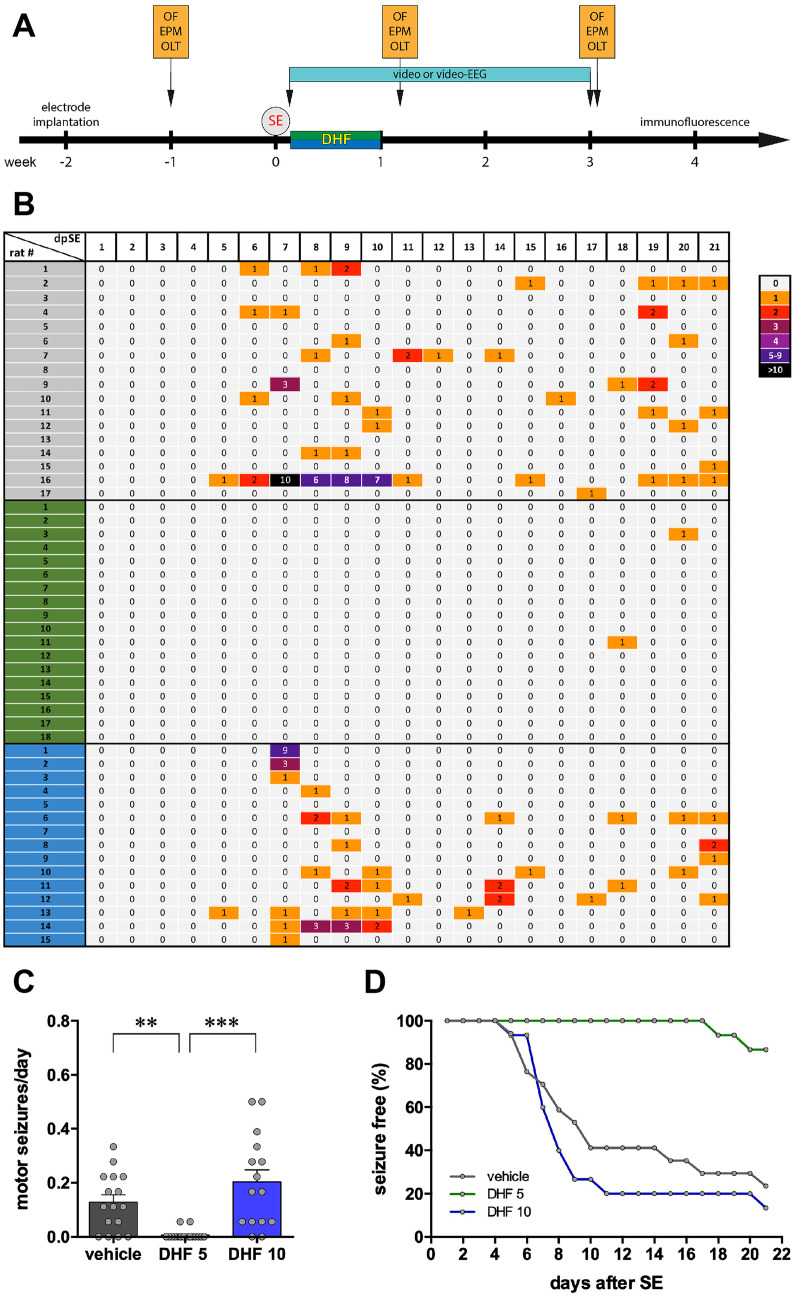
Fig. 1.
Spontaneous motor seizures. (A) Experimental plan. (B) Heat map (one rat per line) of the number of spontaneous motor seizures (class 4 or 5 according to Racine [23]) detected each day during weeks 1–3 after SE. The number of seizures per day is represented using the color code shown at the right of the panel. (C) Average number of spontaneous motor seizures per day in the 3 weeks after SE. Bars represent the mean ± SEM and gray dots represent data from individual animals (vehicle: n = 17; 7,8-DHF 5 mg/kg: n = 18; 7,8-DHF 10 mg/kg: n = 15). **p < 0.01, ***p < 0.001, Kruskal–Wallis one-way ANOVA, and post hoc Tukey’s test. (D) Kaplan–Meier estimates for time to first seizure. Vehicle-treated animals are represented in gray, 7,8-DHF 5 mg/kg (DHF 5) in green, and 7,8-DHF 10 mg/kg (DHF 10) in blue. Abbreviation: EPM, elevated plus maze; OF, open field; OLT, object location task; SE, status epilepticus

