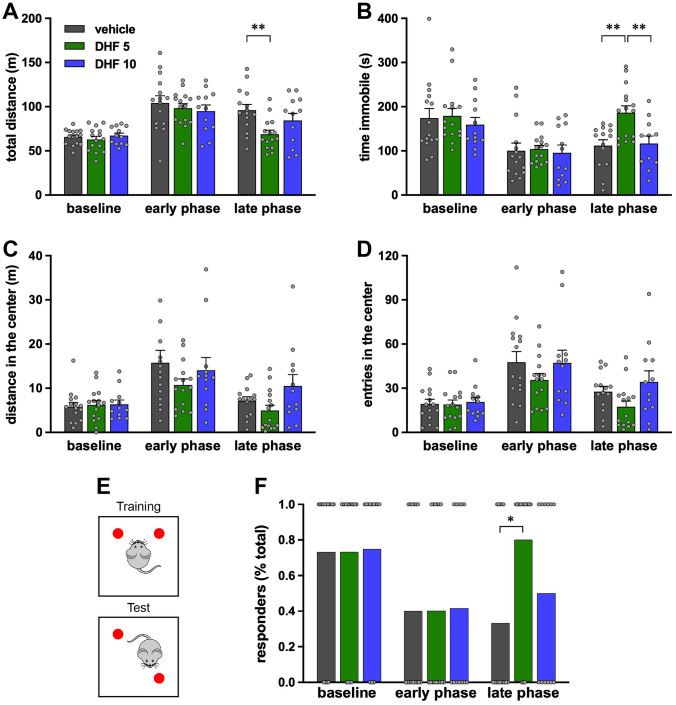
Fig. 3.
Open field (OF) test and object location task (OLT). OF was performed before SE (baseline), 8 days (early phase), or 21 days (late phase) after SE. (A) Total distance run by each rat. (B) Time spent immobile. (C) Distance run in center quadrants. (D) Number of entries in the center quadrants of the arena. Bars represent the mean ± SEM and gray dots represent data from individual animals (vehicle: n = 15; 7,8-DHF 5 mg/kg: n = 15; 7,8-DHF 10 mg/kg: n = 12). **p < 0.01, Kruskal–Wallis one-way ANOVA, and post hoc Tukey’s test. Vehicle-treated animals are represented in gray, 7,8-DHF 5 mg/kg (DHF 5) in green, and 7,8-DHF 10 mg/kg (DHF 10) in blue. (E) Schematic representation of the OLT test (see “Methods” for additional details). Twenty-four hours after the habituation phase in the empty arena, animals were allowed to explore two identical objects for 5 min (training phase). After a 2-h interval, animals were re-entered in the arena, where one object was moved in a different location, and allowed to explore the objects for another 5 min (testing phase). (F) Percent of animals spending more time exploring the re-positioned object. Gray dots represent individual animals. Vehicle-treated animals are in gray, 7,8-DHF 5 mg/kg (DHF 5) in green, and 7,8-DHF 10 mg/kg (DHF 10) in blue. *p < 0.01, Fisher’s exact test

