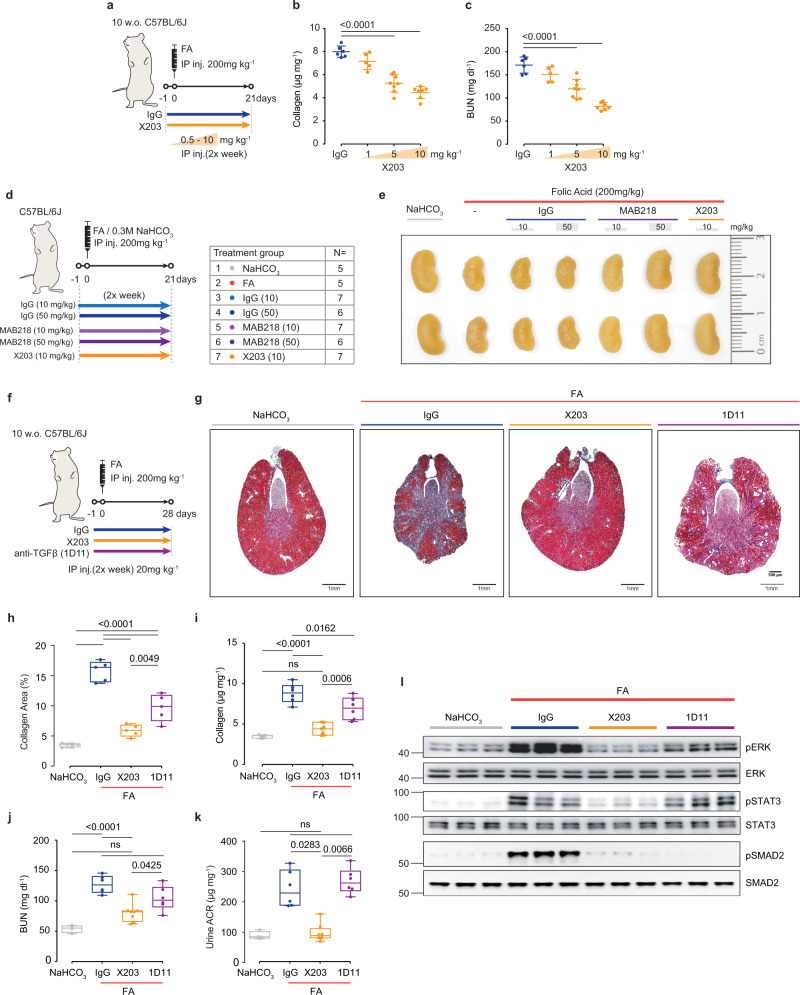
Fig. 3. Therapeutic comparison of X203, MAB218, and anti-TGFβ on renal phenotypes following acute kidney injury.
a Schematic of X203 dose-finding experiments for experiments shown in (b, c). IgG (11E10, 10 mg/kg) or X203 (1–10 mg/kg) was administered to mice 1 day before FA (200 mg/kg) injection. Mice were sacrificed at day 21 post FA (IgG (n = 6), X203 1 mg/kg (n = 5), X203 5 mg/kg (n = 8), X203 10 mg/kg (n = 7)). b Kidney collagen content by hydroxyproline assay and c BUN levels. d Schematic and e representative kidney gross anatomy for mice that were subjected to X203 and MAB218 treatment regimen following FA-mediated AKI. Mice were randomly divided into 7 groups with the number of mice/group indicated in the table. 10 or 50 mg/kg of IgG, 10 mg/kg of X203 or MAB218 (a commercial anti-IL11 from R&D Systems) were administered twice a week intraperitoneally starting from 1 day before FA injection until the mice were sacrificed (day 21). f Schematic of therapeutic comparison of X203 and anti-TGFβ: 20 mg/kg IgG (11E10), X203, or anti-TGFβ (1D11) was administered to mice 1 day before FA (200 mg/kg) injection for experiments shown in (g–l). Mice were sacrificed on day 28 post FA. g Representative Masson’s Trichrome images of whole kidney cross section (scale bars: 500 µm, representative dataset from n = 5/group), h quantification of collagen area from Masson’s Trichrome-stained kidney sections (n = 5/group), i kidney collagen content by hydroxyproline assay (NaHCO3, FA + IgG, FA + 1D11 (n = 6/group), FA + X203 (n = 7)), j BUN, k urine ACR. j, k NaHCO3 (n = 4), FA + IgG, FA + 1D11 (n = 6/group), FA + X203 (n = 8). l Western blots of ERK, STAT3, and SMAD2 activation (representative dataset from n = 5/group). b, c Data are shown as mean ± SD, h–k data are shown as box-and-whisker with median (middle line), 25th–75th percentiles (box), and minimum–maximum values (whiskers). b, c One-way ANOVA with Dunnett’s correction, h, i one-way ANOVA with Tukey’s correction, k Kruskal–Wallis with Dunn’s correction. Source data are provided as a Source data file.

