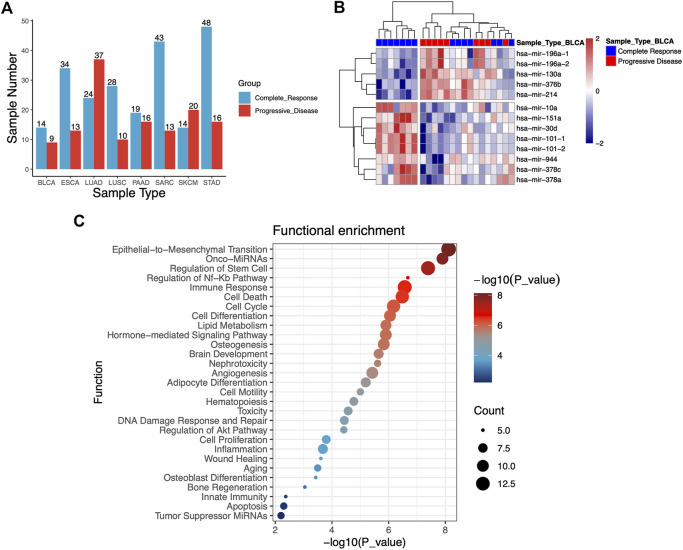
FIGURE 1.
(A) Statistical histogram of cancer types of samples and grouping. The samples of cancer patients were categorized into complete response (S) group and progressive disease (R) group depending on their clinical response to RT treatment. A total of 358 tumor samples across eight different types of human cancers from TCGA database are analyzed. (B) Heatmap of 13 miRNAs that were differentially expressed from S and R samples in the bladder urothelial carcinoma (BLCA). (C) Functional enrichment analysis of 47 differentially expressed miRNAs.

