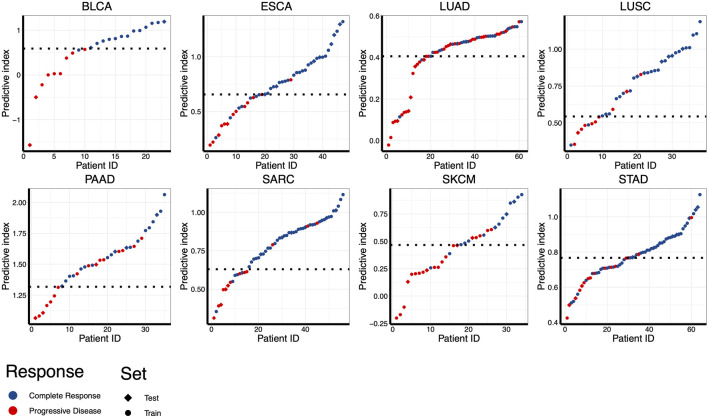
FIGURE 4.
Assessing the performance for distinguishing RT responsive samples in eight different cancer types using combinatorial models. Predictive indexes were calculated to classify samples. Patients are shown in columns, and predictive index was showed in rows. The optimal cut-off value for distinguishing S and R samples was indicated by a dotted line. Samples of training set were indicated by circles, and samples of test set were indicated by diamonds.

