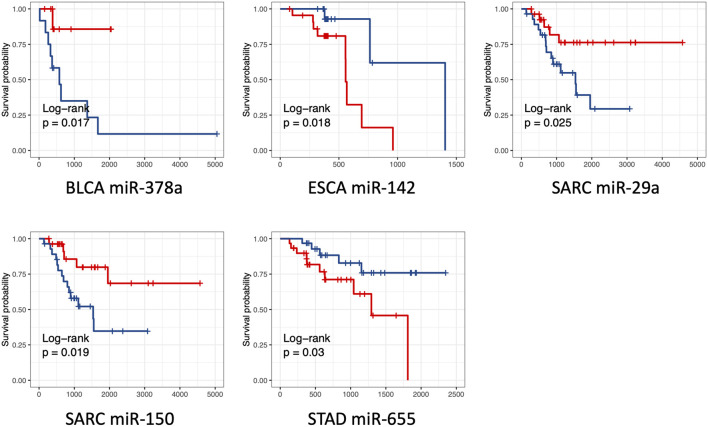
FIGURE 6.
Kaplan Meier overall survival curves for patients with one single miRNA stratified by high versus low miRNA expression. Results from five miRNAs with low p values (p values <0.05) were shown. The high and low expression was indicated with red and blue color, respectively. p values were derived from log-rank test.

