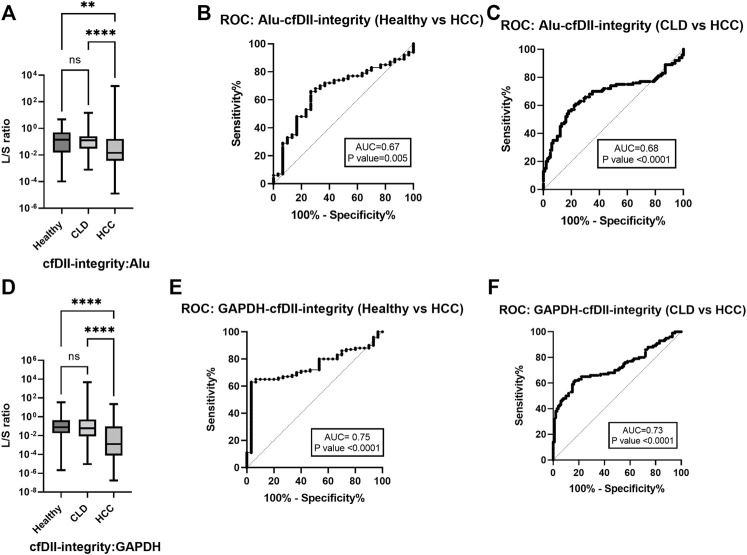
FIGURE 2.
The cfDII-integrity (L/S ratio) differentiating HCC from CLD and healthy subjects. (A) ALU gene cfDII-integrity (L/S ratio) among healthy, CLD and HCC patients; (B) The ROC plot of ALU gene cfDII-integrity differentiating HCC from healthy subjects; (C) The ROC plot of ALU gene cfDII-integrity differentiating HCC from CLD patients, (D) GAPDH gene cfDII-integrity (L/S ratio) among healthy, CLD and HCC groups; (E) The ROC plot of GAPDH gene cfDII-integrity differentiating HCC from healthy subjects; (F) The ROC plot of GAPDH gene cfDII-integrity differentiating HCC from CLD patients, ns- Non significant, **- p value = 0.005, ****- p value < 0.0001.

