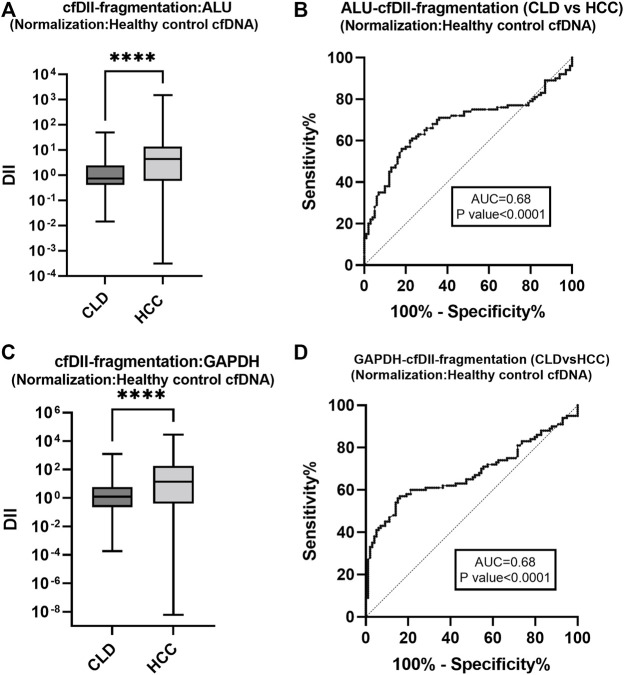
FIGURE 4.
The cfDII-fragmentation following normalization with healthy control cfDNA for comparison between CLD and HCC patients. The cfDII-fragmentation median value of CLD and HCC patients following normalization with healthy control cfDNA for ALU element (A) and GAPDH gene (C). The ROC plot of ALU element cfDII-fragmentation differentiating HCC from CLD patients (B). The GAPDH gene cfDII-fragmentation ROC plot differentiating HCC from CLD patients (D). There is an obvious similarity observed between Figure 4B with Figure 3C for ALU element and between Figure 4D with Figure 3F for GAPDH gene. Both of these genes cfDII-fragmentation differentiate HCC from CLD. The primary data are the same for both genes, only the normalization method is different one is with cellular genomic DNA (Figures 3C,F) other is with healthy control cfDNA (Figures 4B,D). Therefore, the ROC pattern is similar even though data and cut-off points are different after normalization. ****- p value < 0.001.

