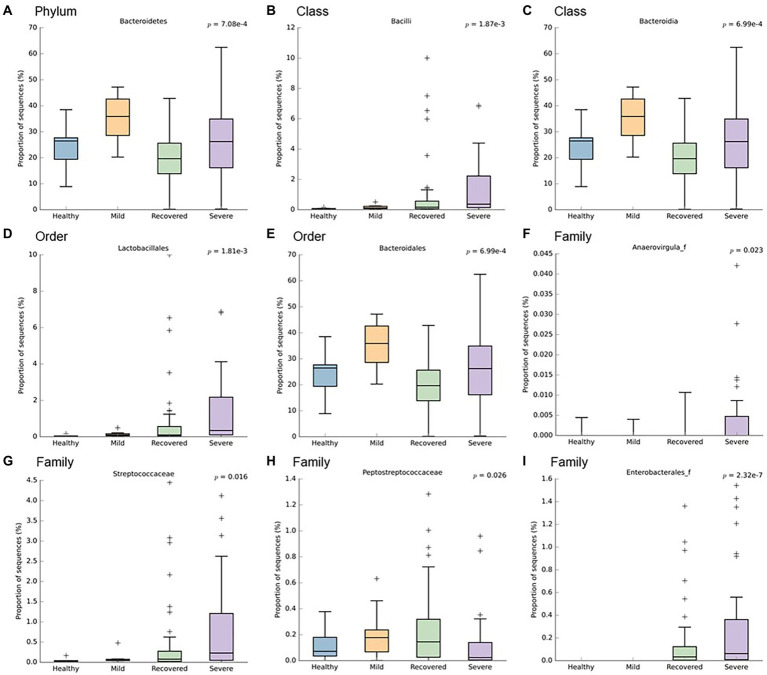
Figure 3.
Boxplots representing the relative abundance of significant bacteria: (A) Bacteroidetes, (B) Bacilli, (C) Bacteroidia, (D) Lactobacillales, (E) Bacteroidales, (F) Anaerovirgula, (G) Streptococcaceae, (H) Peptostreptococcaceae, (I) Enterobacterales. This analysis was performed with Welch’s t-test and an effect size filter of 0.05, to compare the abundance differences between the study’s groups.

