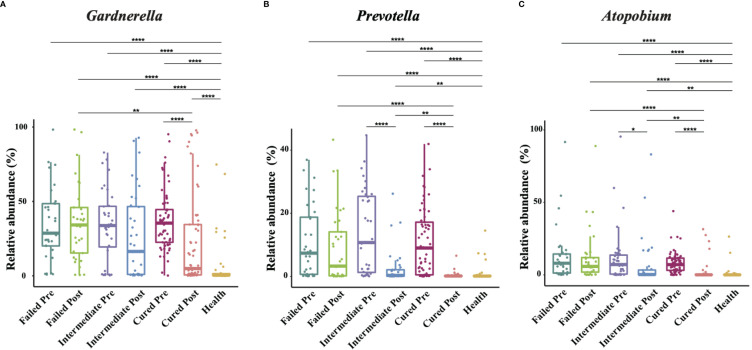
Figure 2.
Comparison of Gardnerella, Prevotella and Atopobium abundance in different groups. Intergroup comparison of Gardnerella (A), Prevotella (B) and Atopobium (C) relative abundance. Only statistically significant P value that has clinical meaning is marked in the graph. Significance is exhibited as: *: p<0.05; **: p<0.01; ***: p<0.001; ****: p<0.0001; Wilcoxon test for pairwise comparison between pre- and posttreatment and Kruskal-Wallis test for comparisons among different groups.

