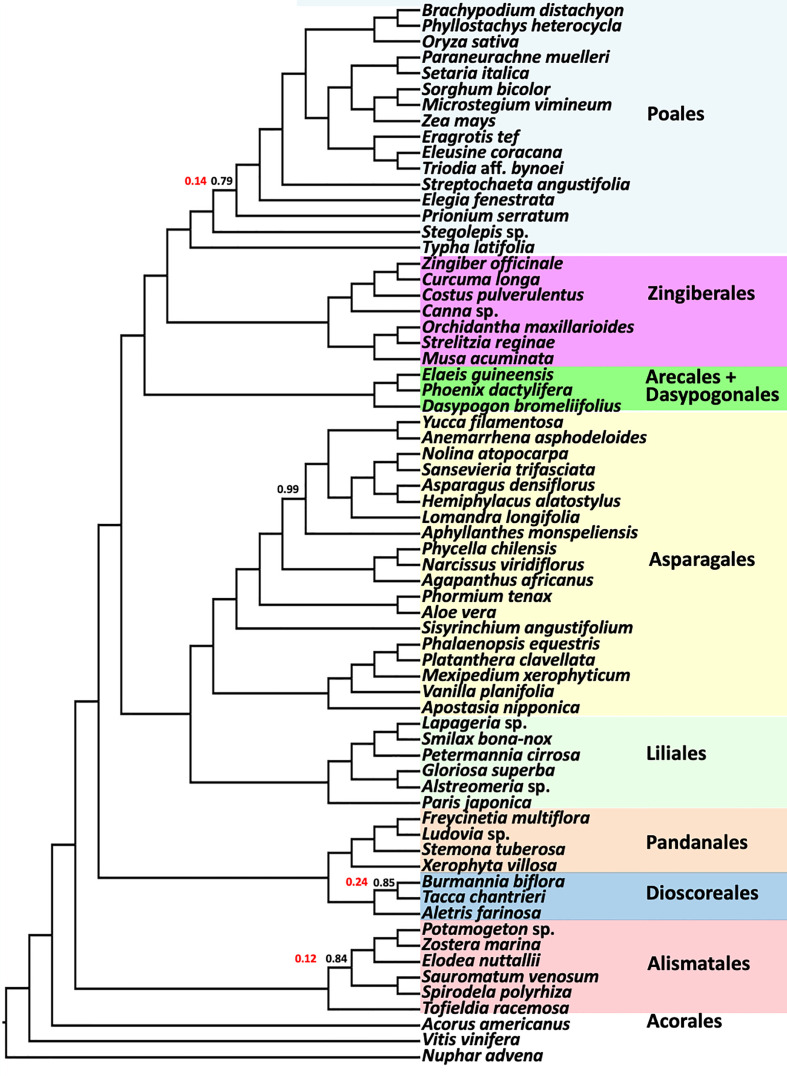
Figure 6.
ASTRAL coalescent analysis of a subsample of 67 taxa using 1375 BUSCO genes. Ordinal color scheme same as Figure 2, showing the same relationships. All values have a LPP=1.0, except as indicated in black. Polytomy test result p-values are shown in red for branches where the null hypothesis of a polytomy is not rejected. Polytomy is rejected (p-value of 0) for all other nodes.

