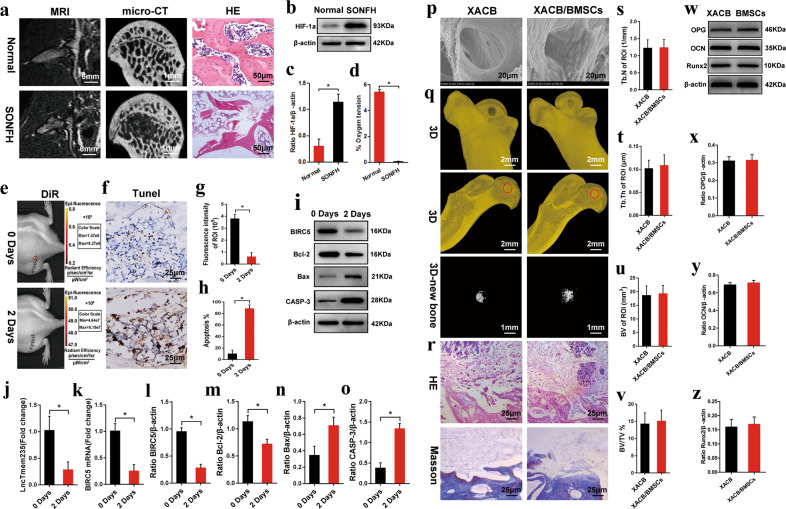
Fig. 6. Transplantation of BMSCs to repair early SONFH.
a MRI, micro-CT, and HE staining were used to evaluate the SONFH model; magnetic resonance imaging (MRI), microcomputed tomography (micro-CT), and steroid-induced osteonecrosis of the femoral head (SONFH); b–c The expression of HIF-1α in the femoral head necrotic area was detected by western blotting (n = 6); hypoxia inducible factor 1 alpha (HIF-1α); d Direct detection of oxygen concentration in the femoral head necrotic area (n = 6); e At 0 and 2 days after surgery, the DiR fluorescence intensity in the transplanted area was detected by live imaging of small animals (n = 8); 1,1-dioctadecyl-3,3,3,3-tetramethylindotricarbocyanine iodide (DiR); f At 0 and 2 days after surgery, apoptosis of transplanted cells was detected by TUNEL staining (n = 6); g Quantitative analysis of the DiR fluorescence intensity in the transplanted area as shown in e (n = 8); h Quantitative analysis of the proportion of TUNEL positive cells in the transplanted area as shown in f (n = 6); i At 0 and 2 days after surgery, the expression levels of BIRC5, Bcl-2, Bax, and CASP3 in the femoral head necrotic area were detected by western blotting (n = 6); j The expression levels of Lnc Tmem235 in the femoral head necrotic area were detected by qPCR (n = 6); k The expression levels of BIRC5 mRNA in the femoral head necrotic area were detected by qPCR (n = 6); l Quantitative analysis of BIRC5 expression as shown in i (n = 6); m Quantitative analysis of Bcl-2 expression as shown in i (n = 6); n Quantitative analysis of Bax expression as shown in i (n = 6); o Quantitative analysis of CASP-3 expression as shown in i (n = 6); p Scanning electron microscope observation of tissue-engineered bone XACB/BMSCs (n = 8); xenogeneic antigen-extracted cancellous (XACB) and tissue-engineered bone (XACB/BMSCs). q At 12 weeks after surgery, micro-CT analysis of the repair of the necrotic area of the femoral head (n = 6); red circle indicates the transplantation area; r At 12 weeks postsurgery, H&E and Masson staining were used to evaluate the repair of the necrotic area (n = 6); hematoxylin-eosin (H&E); s Quantitative analysis of the number of trabeculae as shown in q (n = 6); t Quantitative analysis of the trabecular thickness as shown in q (n = 6); u Quantitative analysis of the volume of new bone tissue as shown in q (n = 6); v Quantitative analysis of the volume fraction of new bone tissue as shown in q (n = 6); w At 12 weeks after surgery, the expression levels of OPG, OCN, and Runx2 in the femoral head necrotic area were detected by western blotting (n = 6); osteoprotegerin (OPG), osteocalcin (OCN), and runt-related transcription factor 2 (Runx2); x Quantitative analysis of OPG expression as shown in w (n = 6); y Quantitative analysis of OCN expression as shown in w (n = 6); z Quantitative analysis of Runx2 expression as shown in w (n = 6). In (c, d, g, h, j–o, s–v, x–z), the data are normally distributed, and the variance is homogeneous. Data are presented as the means ± SDs; statistical significance was calculated by Student’s t test; *P < 0.05.

