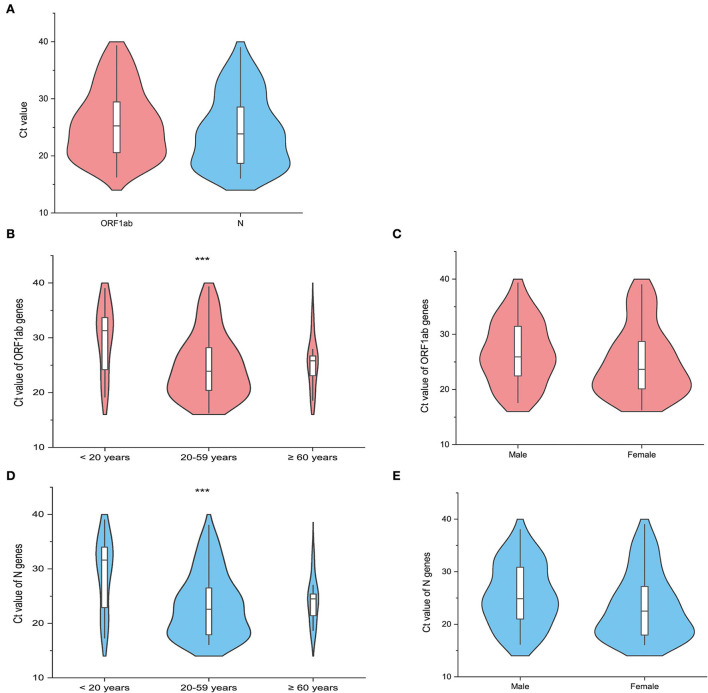
Figure 6.
The distribution of the cycle threshold (Ct) values of the first reverse transcription-polymerase chain reaction (RT-PCR) positive results in the quarantined subjects (N = 92). The violin plot shows the distribution of the Ct values of the open reading frame 1ab (ORF1ab) gene (Orange red) and the Ct values of the nucleocapsid protein (N) gene (Light blue) among the included quarantined subjects (N = 92). The white bar in the center represents the interquartile range (IQR), and the black horizontal line in the white bar represents the median value. Whiskers below and above the white bar indicate the smallest and largest values no further than 1.5 times IQR from the 25th percentile or 75th percentile, respectively. (A) Shows the distribution of Ct values of target genes among all the included cases. The other violin plots show the difference in the Ct values of the target genes (ORF1ab gene and N gene) across different age groups (B,D), including <20 years, 20–59 years, and ≥60 years, and gender groups (C,E). *** represents the P-value with the non-parametric test to be lower than 0.05.

