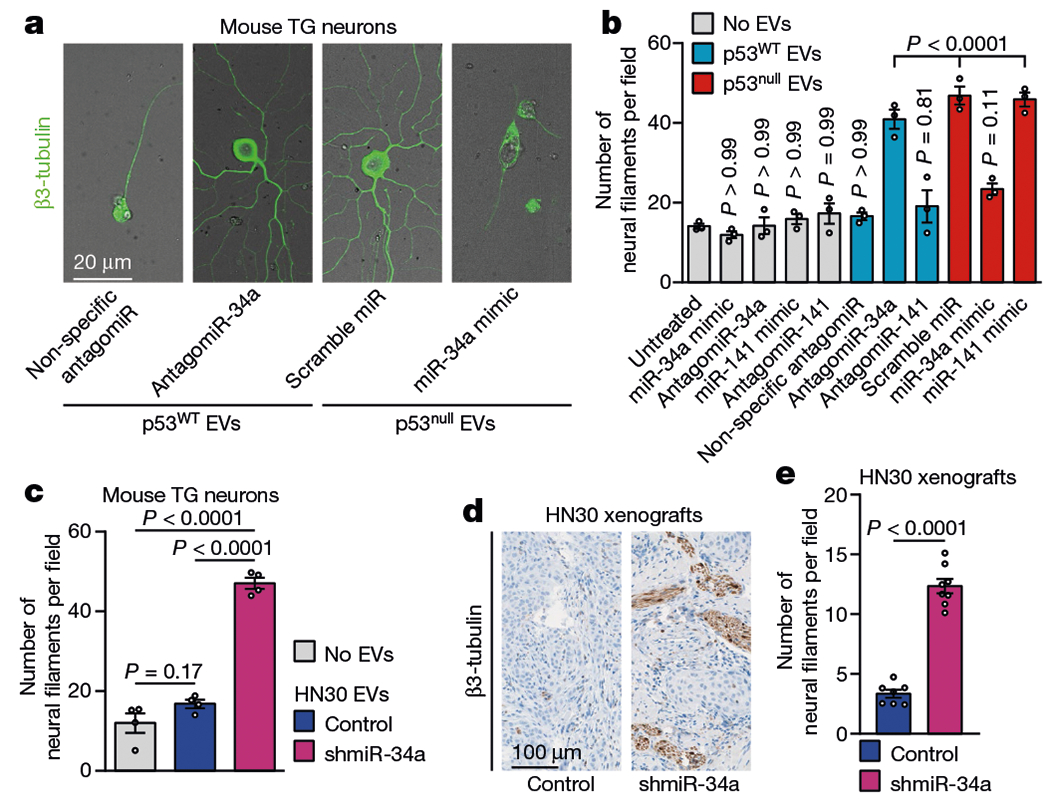
Fig. 2 |. p53-dependent alterations in miRNA populations control neuritogenesis.

a, Representative fluorescence–bright-field overlay images of TG neurons after transfection with antagomiR-34a and incubation with EVs from p53WT PCI-13 cells EVs (left) and after transfection with miR-34a mimic and incubation with EVs from p53null PCI-13 cells (right); data independently replicated in 12 wells. b, Quantification of neuritogenesis 72 h after neuron–EV co-culture. EV-free medium (grey bars) or non-specific antagomiR/miR-mimic transfection were used as controls (n = 3 biologically independent samples per condition). c, Quantification of neuritogenesis in TG neurons 72 h after neuron-EV co-culture using EVs from p53WT OCSCC cells stably expressing a short hairpin targeting miR-34a (shmiR-34a) or non-specific control (n = 4 biologically independent samples per condition). d, Representative images showing β3-tubulin-positive neural fibres in orthotopic OCSCC xenografts stably expressing shmiR-34a (n = 8 mice) or non-specific control (n = 7 mice); data independently replicated in 15 mice. e, Quantification of neural density 3 weeks after orthotopic injection as in d. Bar graphs represent mean ± s.e.m. Unpaired two-tailed t-test (c, e) or one-way ANOVA with Tukey multiple comparisons (b).
