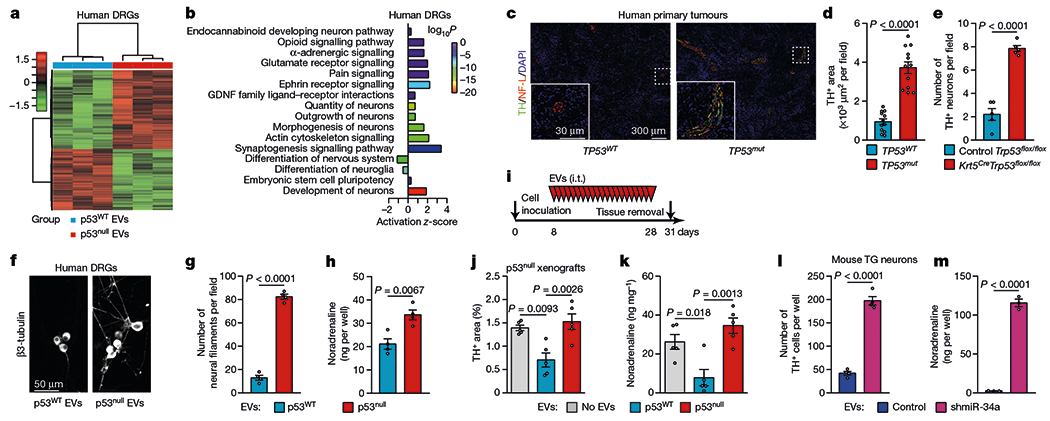
Fig. 3 |. p53-deficient tumours are enriched with adrenergic nerve fibres.

a, b, Heat map (a) and enriched Gene Ontology terms (b) for differentially expressed genes in freshly collected human DRG neurons incubated with EVs from p53WT or p53null PCI-13 cells, plotted by fold enrichment with the associated log P value (Fisher’s exact algorithm for functional gene set enrichment); n = 3 biologically independent samples per condition. c, Representative images showing TH+ adrenergic neural fibres in TP53WT or TP53mut human OCSCC tissue; data independently replicated in 24 patient specimens. d, Quantification of TH+ areas as in c (n = 12 independent samples per group). e, Quantification of TH+ neural fibres in tumours from Krt5CreTrp53flox/flox and control mice (n = 5). f, Representative images of neo-neurites (β3-tubulin+) in human DRG co-cultured with EVs from p53WT or p53null PCI-13 cells; data independently replicated in 8 wells. g, h, Quantification of neuritogenesis (g) and noradrenaline levels (h) in human DRGs as in f (n = 4 biologically independent samples per condition). i–k, PCI-13-p53null orthotopic tumours were injected daily with no EVs (vehicle) or with EVs from p53null or p53WT PCI-13 cells for 3 weeks (n = 5 mice per group, i), and TH+ neural areas (j) and noradrenaline levels (k) in the tongue were measured. l, m, TG neurons were co-cultured with EVs from p53WT OCSCC cells treated with lentiviral miR-34a or non-specific inhibitors. Quantification of TH+ TG neurons (n = 4 mice per condition, l), and noradrenaline levels (n = 3 biologically independent samples per condition, m). Bars represent mean ± s.e.m. Unpaired two-tailed t-test (d, e, g, h, l, m) or one-way ANOVA with Tukey multiple comparisons (j, k).
