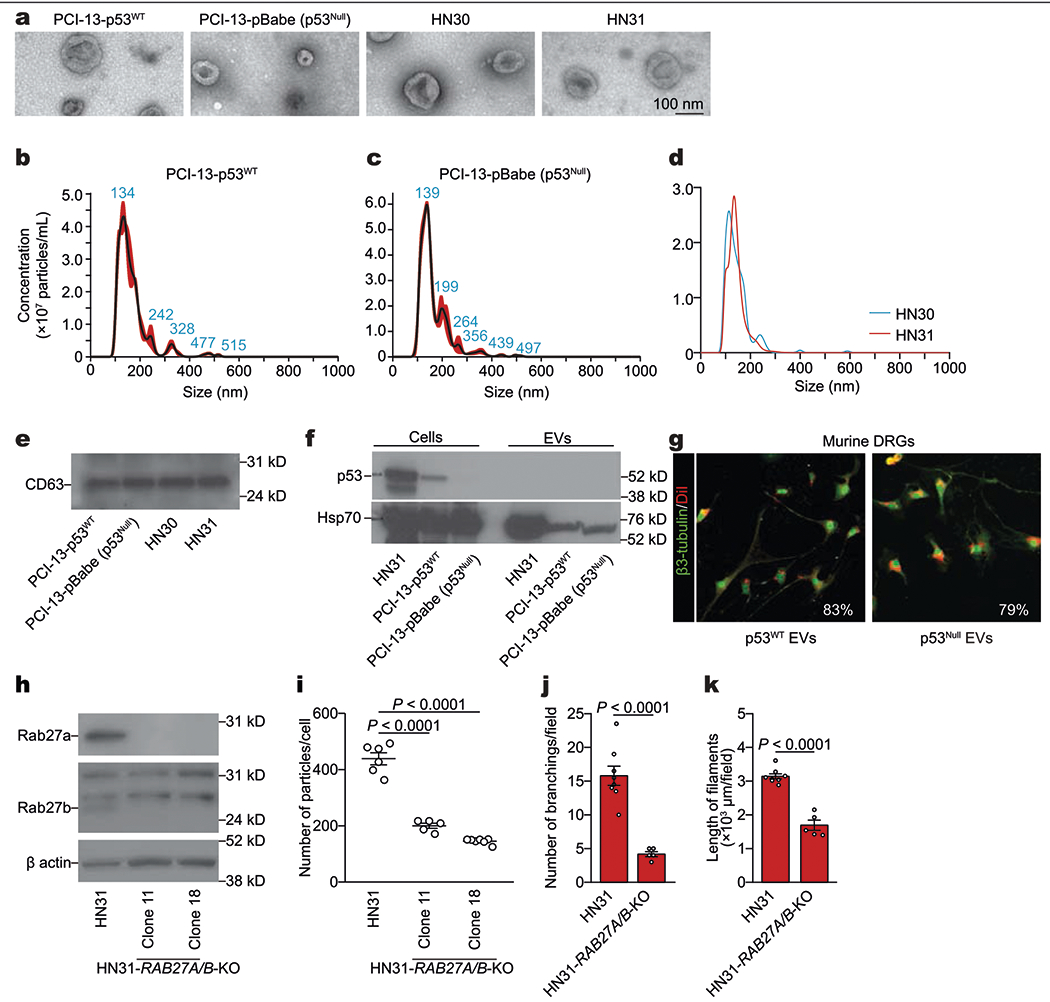
Extended Data Fig. 2 |. OCSCC-derived EVs and neuritogenesis.

a, Representative transmission electron microscopy image of EVs from isogenic PCI-13, HN30, and HN31 OCSCC cells; data replicated in two independent experiments. b–d, Size distribution from nanoparticle tracking analysis of particles derived from p53WT (b) or p53null (c) PCI-13 cells or HN30 and HN31 (d) cells; data replicated in two independent experiments. e, Western blot of the EV marker CD63 in EVs from PCI-13 and HN30/HN31 cells; data replicated in two independent experiments. f, Western blot of the p53 and controls (HSP70) in p53WT or p53Null PCI-13 and HN31 cells and their corresponding cell-derived EVs; data replicated in three independent experiments. g, Confocal immunofluorescence images showing EVs (lipophilic DiI-labelled, red) in the cytoplasm of a neuron (labelled with β3-tubulin, green) 8 h after application of EVs derived from p53WT or p53null PCI-13 cells. Percentage represents the proportion of DiI+ β3-tubulin+ neurons out of all β3-tubulin+ neurons (n = 6 ganglia per condition). h, Immunoblots demonstrating the knockout (KO) of RAB27A and RAB27B in OCSCC cells edited with sgRNAs targeting RAB27A and RAB27B (HN31 clones 11 and 18, respectively) compared with HN31 controls; data replicated in two independent experiments. i, Nanoparticle tracking analysis of EV particle number in conditioned medium from HN31 clones 11 (n = 5 biologically independent samples) and 18 (n = 7 biologically independent samples) compared with HN31 controls (n = 6 biologically independent samples). Number of EVs was adjusted to cell number; bars represent mean ± s.e.m. Unpaired two-tailed t-test. j, k, In vitro quantification of branching (j) and neurofilament length (k) in freshly collected DRGs cultured with conditioned medium from HN31 RAB27A+/+RAB27B+/+ (n = 8) and HN31 RAB27A−/−RAB27B−/− (n = 5) isogenic human OCSCC cells. Bar graphs and tumour growth curves represent mean tumour volume ± s.e.m. Unpaired two-tailed t-test.
