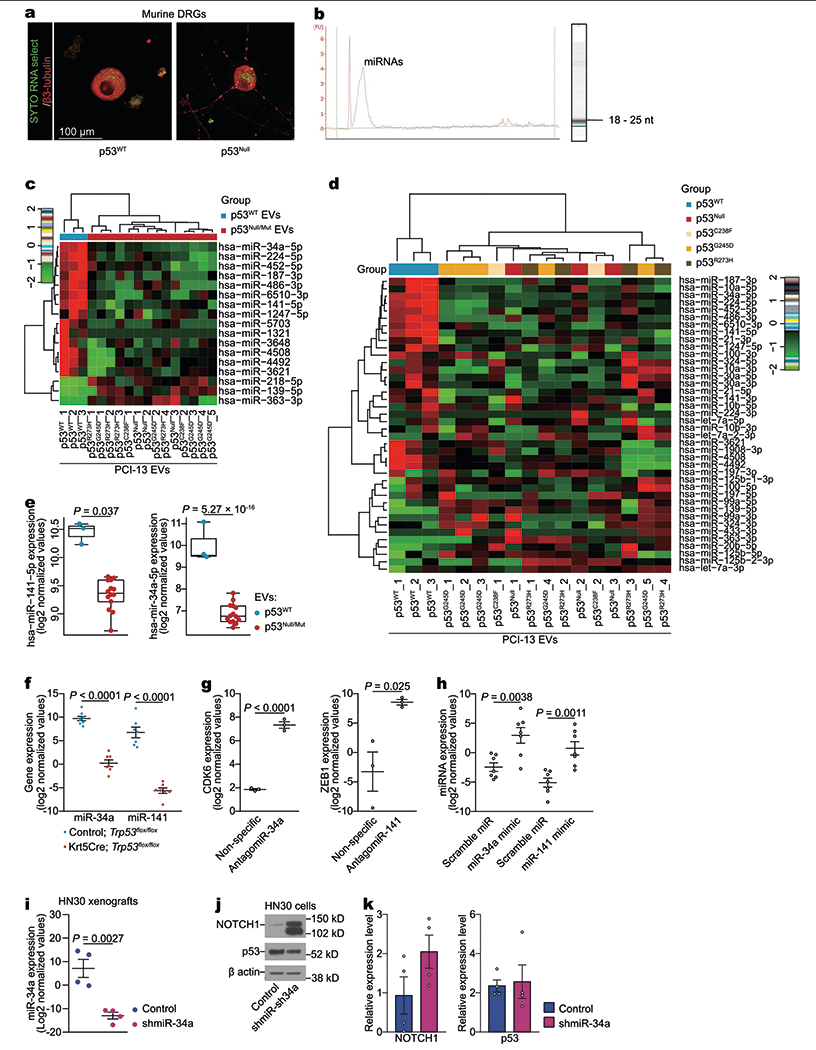
Extended Data Fig. 3 |. p53-dependent miRNA in OCSCC.

a, OCSCC RNA transfer to neurons via EVs. Representative confocal immunofluorescence image demonstrating PCI-13 cell-derived RNA labelled with SYTO RNASelect (green) in the perinuclear cytoplasm of a neuron (labelled with β3-tubulin, red). Images were captured 12 h after application of EVs derived from PCI-13 cells labelled with SYTO RNASelect; data replicated in two independent experiments. b, EVs derived from PCI-13 cells contained mainly small RNA species. Bioanalyzer results showing presence of RNA in EVs from PCI-13 cells. Representative band of EV RNA by Agilent RNA Pico Chips; data independently replicated in ten experiments. c, An unsupervised hierarchical clustering heat map showing differentially expressed EV miRNAs between p53-isogenic PCI-13 cells. p53WT, n = 3 biologically independent samples; p53null and p53mut, n = 14 biologically independent samples. d, Heat map of differentially expressed miRNA, arranged by unsupervised hierarchical clustering, presenting the miRNA sequencing for EVs derived from isogenic PCI-13 cells expressing p53WT versus no p53 (p53null) or mutant p53 (p53C238F, p53G245D, and p53R273H). The Pearson distance and Ward’s minimum variance method were used for pairwise clustering (c, d). Red and green indicate increased and decreased expression levels, respectively (n = 2 to 5 per group). e, Fold change in hsa-miR-141-5p and hsa-miR-34a-5p in EVs derived from p53WT PCI-13 cells (blue, n = 3 biologically independent samples) compared with p53null or p53mut cells (red, n = 14 biologically independent samples). Results are log2 normalized. f, Real-time PCR quantification of miR-34a and miR-141 in ventral tongues from Trp53flox/flox and Krt5CreTrp53flox/flox mice (n = 7 per group). g, Real-time PCR quantification of CDK6 (miR-34a target) and ZEB1 (miR-141 target) in neurons treated with antagomiR-34 or antagomiR-141 compared with nonspecific antagomiR-treated controls (n = 3 biologically independent samples per group). h, Quantitative validation of miR-34a and miR-141 overexpression after transfection with miR-34a and miR-141 mimics, respectively. TG neurons were transfected with miR-34a mimic, miR-141 mimic, or scramble miR, and overexpression of miR-34a and miR-141 was confirmed by real-time PCR (n = 7 biologically independent samples per group). i, Real-time PCR quantification of miR-34a in orthotopic tumour xenografts of HN30 OCSCC cells treated with shControl (blue) or shmiR-34a (purple). n = 4 biologically independent samples per group. j, k, Western blot of NOTCH1 (confirmed miR-34a target) in OCSCC transfected with lentiviral miR-34a inhibitor or scramble miRNA inhibitor (j). Bar graph quantification of the blots demonstrates no impact of miR-34a inhibition on p53 expression and is normalized to the total amount of β-actin (n = 4 biologically independent samples per group, j). Unpaired two-tailed t-test; bars and dot plots represent mean ± s.e.m. (e–i, k).
