Fig. 1.

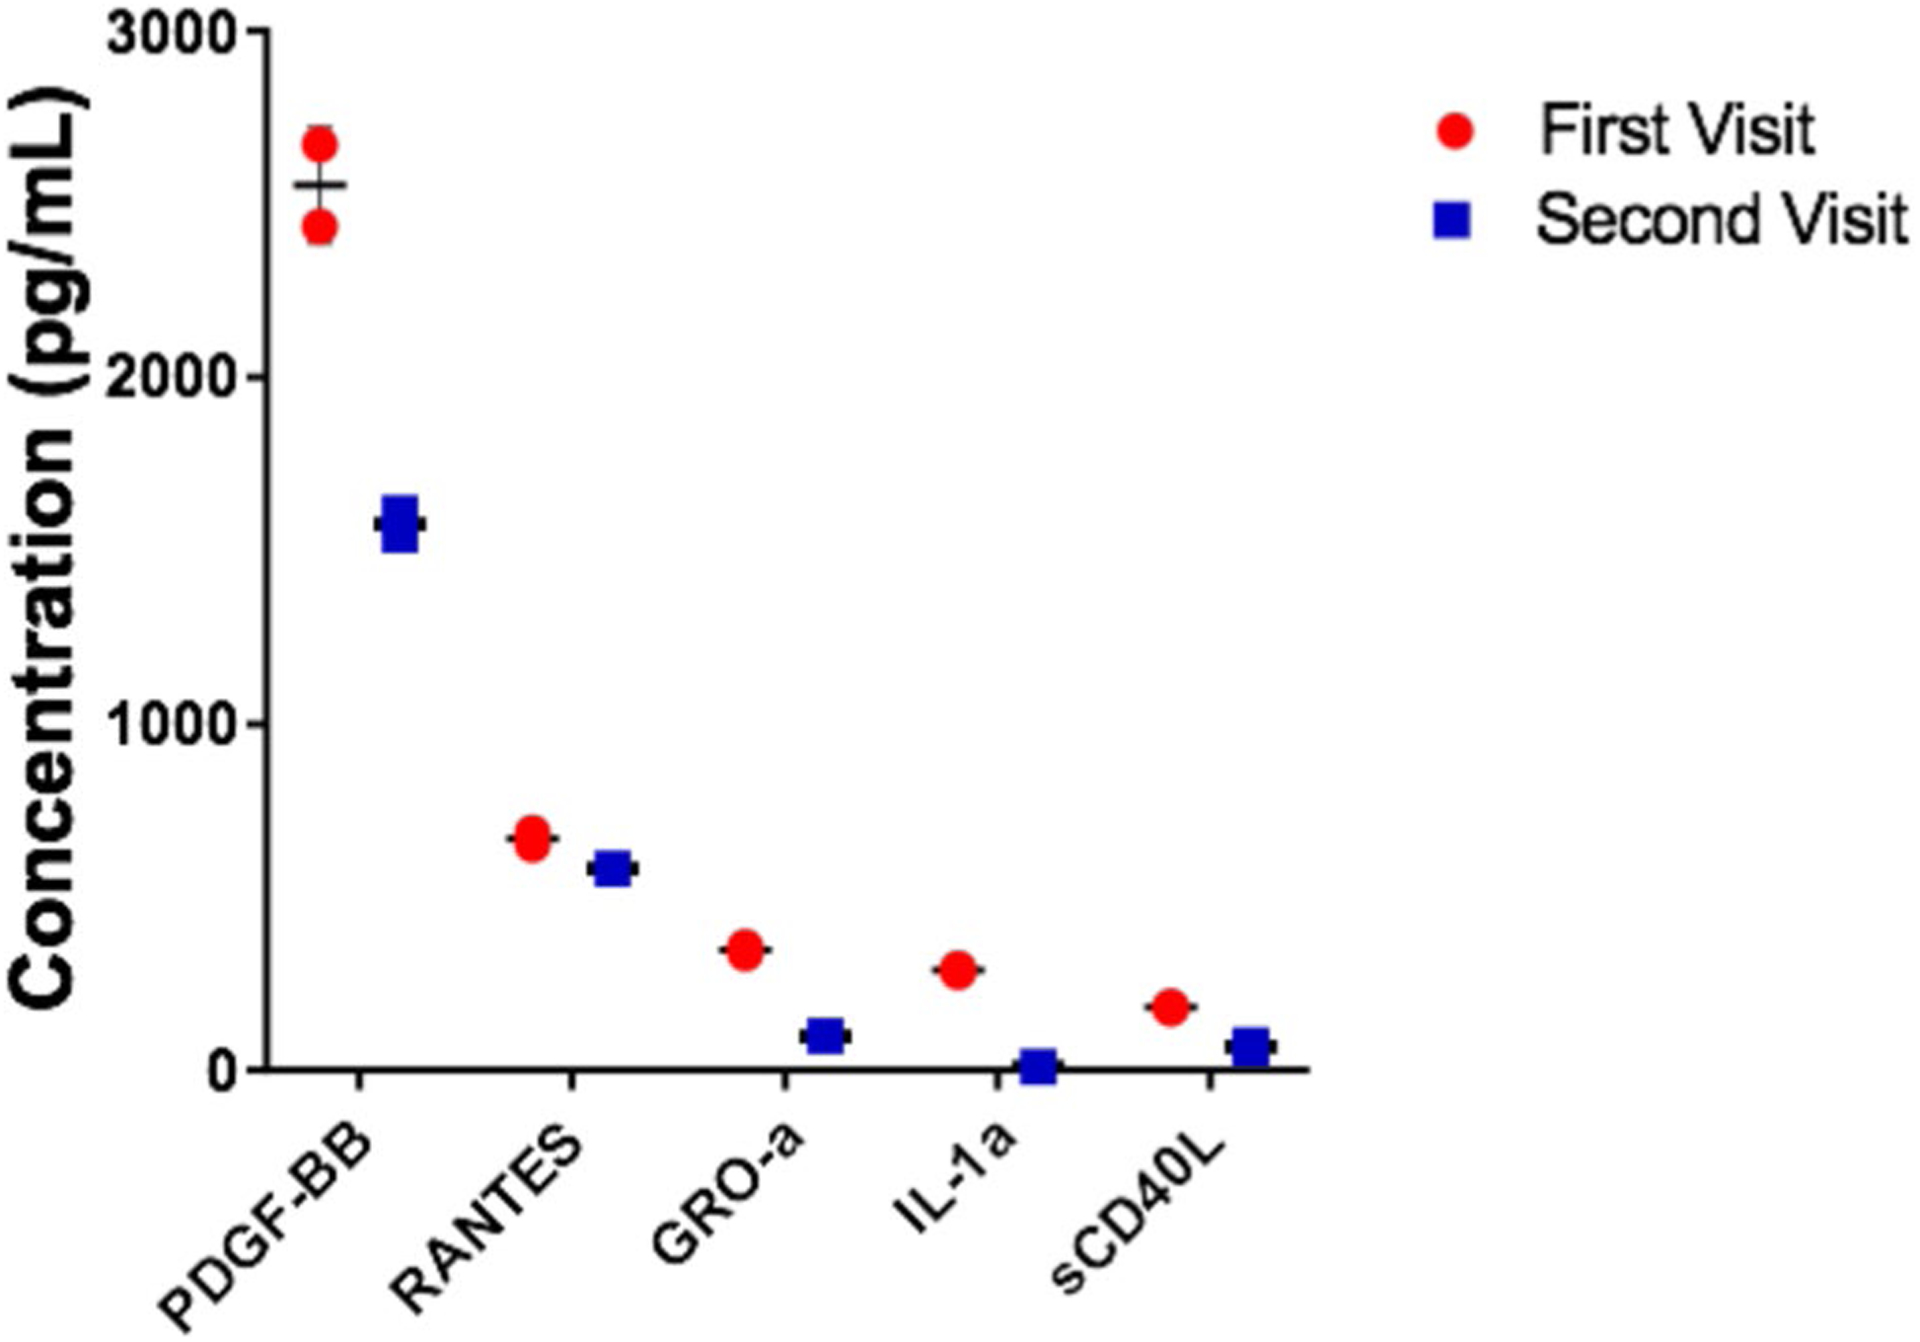
Cytokine and chemokine expression profile in plasma samples of a RRMS patient during both the visits. The top five cytokines/chemokines expressed in the RRMS patient plasma during both the visits. Values are mean ± SD (n = 2)

Cytokine and chemokine expression profile in plasma samples of a RRMS patient during both the visits. The top five cytokines/chemokines expressed in the RRMS patient plasma during both the visits. Values are mean ± SD (n = 2)