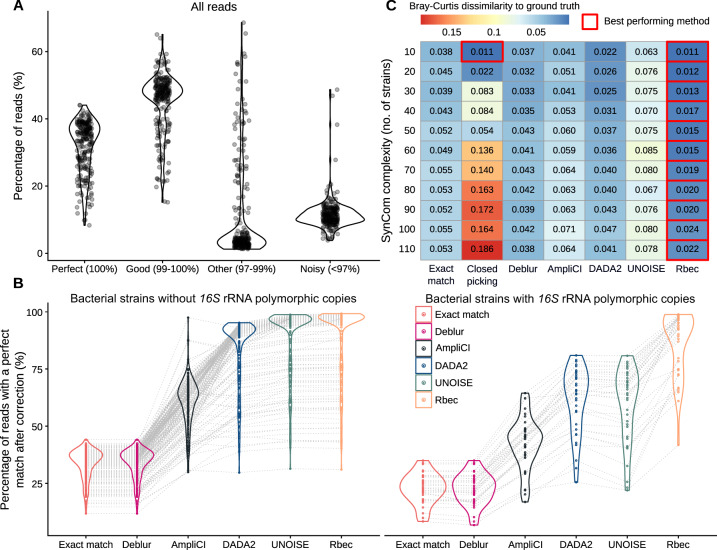
Fig. 2. Evaluation of the Rbec algorithm.
A Error profiles of amplicon sequencing data from 234 bacterial strains sequenced on the Illumina platform. B Percentage of perfectly aligned reads after correction with different methods, including samples generated from strains with or without polymorphic copies of the 16S rRNA gene. C Evaluation of the influence of community complexity on the performance of different methods, measured as a deviation from the ground truth using Bray-Curtis dissimilarities. The columns represent the different methods and the rows correspond to the number of strains used to generate the SynCom mock community data. The values inside the heatmap refer to the averaged Bray-Curtis dissimilarities over 20 replicates for each SynCom combination.

