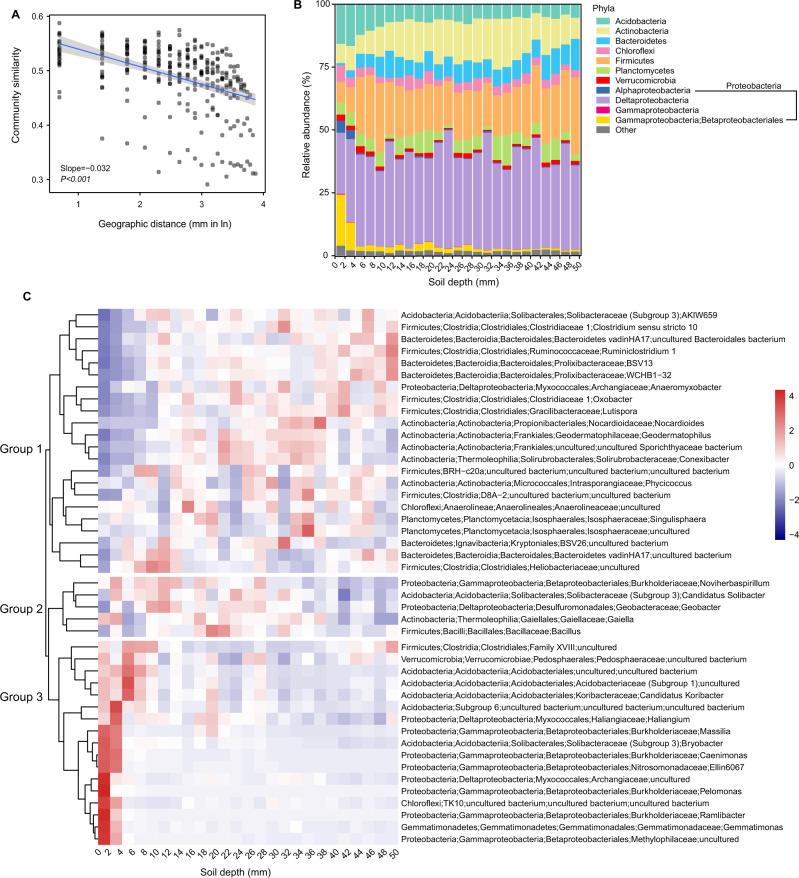
Fig. 1. Community composition of the active microbial communities based on relative abundance of 16S rRNA gene transcripts through a 50 mm water–soil interface.
A Changes in Bray-Curtis similarities of microbial communities with spatial distance. A linear trend was determined using ordinary least-squares linear regression with the shaded area representing 95% confidence intervals. B Relative abundance of phyla. Only those with a relative abundance ≥1% were included, while those <1% categorized as “Other”. C Heatmap showing the relative abundance difference of the selected 44 bacterial genera (relative abundance ≥1%). An increase in abundance tends toward red, while a decrease tends toward blue.

