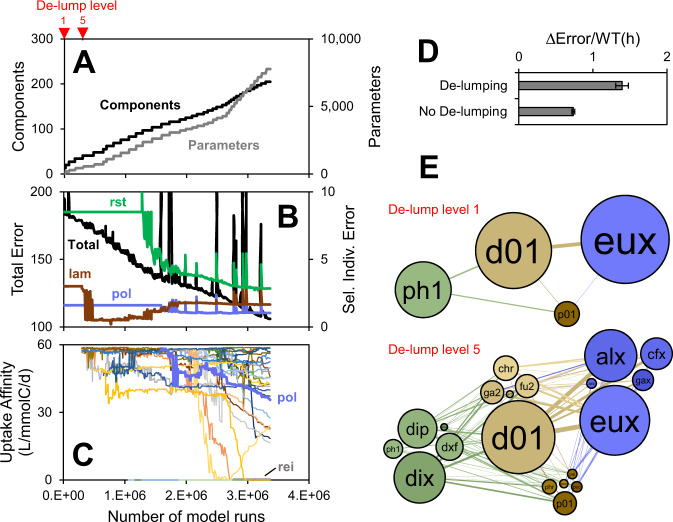
Fig. 1. FluxNet inference method illustration.
A Number components and optimized parameters. B Error for entire model (Total) and selected individual observations (rst = R. styliformis, pol = Polaribacter, lam = particulate chrysolaminarin). Best of 128 replicate runs. C Diversification of chrysolaminarin uptake affinity (max. heterotrophy rate/half-saturation constant). D Method performance with and without de-lumping. E Network corresponding to different de-lump levels. See Table 1 for component names and abbreviations.

