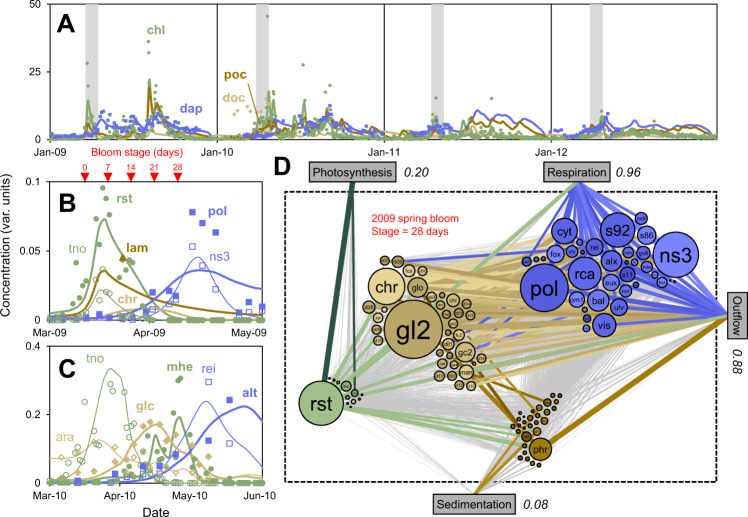
Fig. 2. FluxNet model results and comparison to data.
A All model types lumped. Phytoplankton (chl, μgChla/L), POM (poc, incl. microbes, μmolC/L ×0.1*), DOM (doc, μmolC/L ×0.1*), bacteria (dap, 1e6/mL ×3*). Gray shading are spring blooms, defined as the first time of the year the phytoplankton exceeds 3 µgChla/L plus 28 days. B Selected types for 2009 spring bloom. Rhizosolenia styliformis (rst, centric diatom, 1e6/L ×1.2*), Thalassiosira nordenskioeldii (tno, centric diatom, 1e6/L ×0.05*), particulate chrysolaminarin (lam = phr + phytoplankton content, μmolC/L ×0.002*), dissolved chrysolaminarin (chr, μmolC/L ×0.002*, no data available), Polaribacter (pol, DAPI × CARD-FISH, 1e6/mL ×0.1*), NS3a marine group (ns3, 1e6/mL ×0.2*). C Selected types for 2010 spring bloom. Mediopyxis helysia (mhe, centric diatom, 1e6/L), Thalassiosira nordenskioeldii (tno, centric diatom, 1e6/L), glucose-containing HMW DOM (glc, μmolC/L ×0.01*), arabinose-containing HMW DOM (ara, μmolC/L ×3*), Reinekea (rei, 1e6/mL ×5*), Alteromonas (alt, 1e6/mL ×1.5*). Lines are model and symbols are data [27–29]. *Individual concentration series scaled to illustrate dynamics. See Fig. S1 for all model-data comparisons. Upside-down triangles mark various bloom stages for networks in (D) and Fig. 4A. D Inferred carbon flux network. Nodes are components. Size indicates in/outflux (μmolC/L/d), color varied randomly within each ecological compartment. Lines are fluxes. Thickness is proportional to log flux (μmolC/L/d), colored based on the source node, lines below a threshold distance are colored gray to highlight most important fluxes. Italic numbers are total fluxes (μmolC/L/d). Flux cut off is 0.01%. See Table 1 for component names and abbreviations. See Movie S1.

