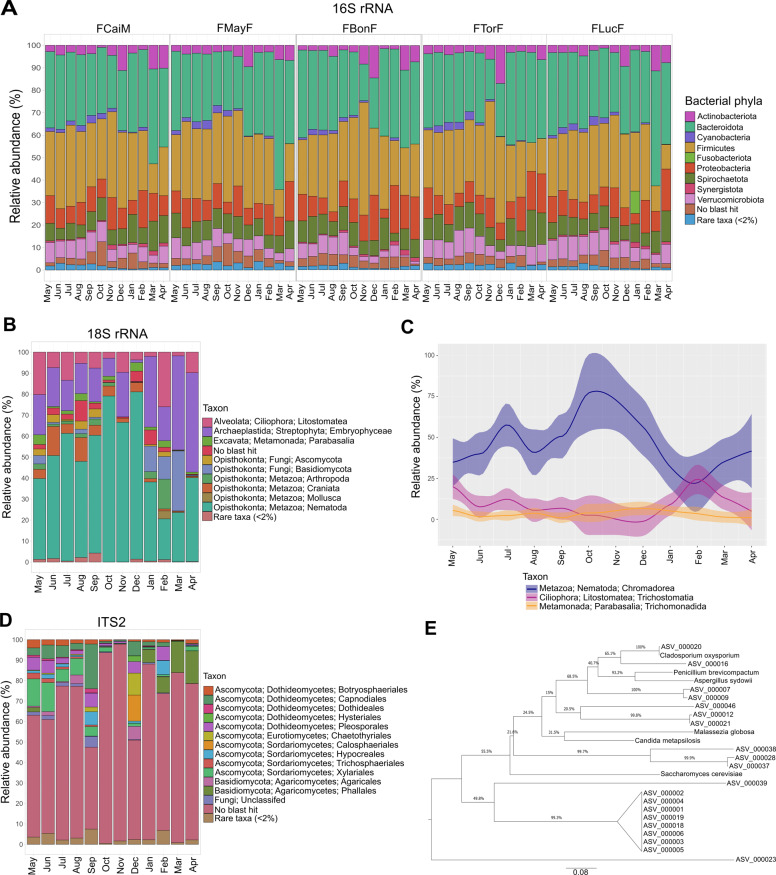
Fig. 1. Prokaryotic and eukaryotic communities from the gut of redfronted lemurs during the study period from May 2018 until April 2019.
A Monthly relative abundances of bacterial phyla for the five studied individuals as determined from 16 S rRNA gene sequencing. Bar charts depict relative abundances of bacterial phyla from normalized counts for each individual per month. All phyla with abundances <2% were grouped as rare taxa. B Eukaryotic organisms detected in the fecal samples through 18 S rRNA gene sequencing. Bar charts show monthly relative abundances of eukaryotic classes from normalized counts. All phyla with abundances <2% were grouped as rare taxa. C Monthly fluctuations in the relative abundances of Chromadorea, Trichostomatia, and Trichomonadida. Linecharts depict relative abundances of normalized counts of the detected eukaryotic parasites or endosymbionts in the fecal samples. D Fungal organisms detected in the fecal samples through ITS2 sequencing. Barcharts display monthly relative abundances of fungal orders from normalized counts. All taxa with abundances <2% were unified as rare taxa. E Maximum likelihood phylogenetic tree of the unclassified ITS2 ASVs against representative Fungi.

